Wednesday, November 22, 2006

Policy Agreements and Disagreements

The possibility of dissention among Democrats regarding economic policy seems to have been in the news this week. Mark Thoma points us to a commentary by Harold Meyerson on the subject, in which he focuses on the differences between the Hamilton Project and the EPI. And yesterday, Bloomberg had a piece about the disagreements between Robert Rubin and organized labor.
Nov. 22 (Bloomberg) -- Democrats are returning to power on Capitol Hill just as two powerful wings of the party, labor and Wall Street, are colliding over economic issues.

The dispute over trade and budget policies prompted a high- level private meeting earlier this month between AFL-CIO President John Sweeney and former Treasury Secretary Robert Rubin, who is now chairman of the executive committee at New York-based Citigroup Inc.

AFL-CIO leaders, contending Democrats won the midterm elections because of voter concern about job security and stagnant wages, say it's time to set aside the free-trade policies touted by Rubin.

"We need to review the Rubin agenda that's led to millions of lost jobs and declining standard of living for the middle class,'' said United Steelworkers President Leo Girard. "It's an agenda that has been very good for Citigroup and the financial community because they've been able to finance the relocation of jobs and refinance the trade deficits.''
I suppose that it's natural for people to want to revisit this subject in the wake of the Democrats' recent election victory. But is this really news? As Mark pointed out, Democrats from both the Rubin/Hamilton Project crowd and the EPI/organized labor crowd would probably agree, at least in broad terms, on a large number of changes to economic policy. My candidates for areas of general agreement would include:
  • Allowing the tax cuts on the wealthiest to expire, to help with the budget deficit;
  • Restore pay-as-you-go rules to the federal budget process, to at least stop the US's budget problems from getting worse;
  • Reform the Medicare prescription drug benefit to allow the government to reduce the price it pays for prescription drugs;
  • Strive for broader health insurance reform, to increase the availability of health insurance to uninsured Americans;
  • Strengthen the social safety net to help individuals who are lose out in the US economy through no fault of their own (e.g. by providing some form of wage insurance);
  • Increase the minimum wage.
I'm sure I'm leaving something out, but even so, there's clearly a lot here that both camps would agree on, and a lot of work to do.

On the other hand, there is one big thing that the two factions do not agree on: trade policy. So if you boil it all down, it seems that the one significant point of dissention among Democrats is about how to change (if at all) US trade policy.

But the existence of pro-trade and anti-trade groups in the Democratic party is nothing new - they've both been around since at least the 1980s. Furthermore, very vocal anti-trade and pro-trade factions also exist within the Republican party; for example, a dozen Republican Senators voted against CAFTA this past summer, while a dozen Democrats supported it.

Yes, the issue of trade policy is indeed a source of disagreement among Democrats. But it's also a source of disagreement among Republicans, and among independent voters. So while the anti-trade faction may be larger in the Democratic party than in the Republican party (at least if measured by votes in Congress), the divisions over trade policy really seem to often transcend party and ideology. I haven't yet figured out what separates people into the anti-trade and the pro-trade groups, but whatever it is, I don't think that the division is anything new, or unique to Democrats.


UPDATE: Menzie Chinn has additional commentary (thoughtful and informative, as always) about the question "Are the Democrats Truly More Protectionist?" over at Econbrowser. In short, Menzie's answer is no.

Tuesday, November 21, 2006

Housing Market Nonsense

My head feels a like it's going to explode. How does one reconcile these two statements, from today's Wall Street Journal:
The worst of the housing bust is over, economists said by nearly 2-to-1 in the latest WSJ.com economic forecasting survey.
and
The 49 economists responding to the WSJ.com forecasting survey expect home prices, measured by the government's Office of Federal Housing Enterprise Oversight index, to rise 2.8% this year and to fall by 0.5% next year. That contrasts with a 13.4% increase in 2005.
Can someone explain to me how house prices rising a little this year, and then actually falling next year, is consistent with the notion that "the worst is over"? To me, "the worst is over" somehow implies that next year will be better than this year. Am I wrong? I don't understand.

As a reminder, here's what happened to housing prices in a couple of major cities during the last downturn in the housing market.


If you define "the worst is over" as "the decline in the rate of change of the rate of change in house prices is moderating," then you might have been able to say that the worst was over by the end of 1990. And by that definition, I suppose one could possibly argue that the worst is over today.

But that's a pretty tortuous and ill-conceived definition of "the worst", in my opinion. I think most people who tried to sell a house during the early 1990s would agree that it took years for the worst of that housing market slowdown to pass. Do we really think that today will be the last time we'll read a story like this one?

The real estate market is notoriously cyclical. But historically, those cycles have been 10 or 15 years, not months, in length. I can't see why this time should be any different.

Thursday, November 16, 2006

Milton Friedman

From the AP:
Economist Milton Friedman dies at 94

SAN FRANCISCO - Milton Friedman, the Nobel Prize-winning economist who advocated an unfettered free market and had the ear of three U.S. presidents, died Thursday at age 94. Friedman died in San Francisco, said Robert Fanger, a spokesman for the Milton and Rose D. Friedman Foundation in Indianapolis. He did not know the cause of death.

"Milton's passion for freedom and liberty has influenced more lives than he ever could possibly know," said Gordon St. Angelo, the foundation's president and CEO, said in a statement. "His writings and ideas have transformed the minds of U.S. presidents, world leaders, entrepreneurs and freshmen economic majors alike."

In more than a dozen books, a column in Newsweek magazine and a TV show on PBS, Friedman championed individual freedom in economics and politics. The longtime University of Chicago professor pioneered a school of thought that became known as the Chicago school of economics.

His theory of monetarism, adopted in part by the Nixon, Ford and Reagan administrations, opposed the traditional Keynesian economics that had dominated U.S. policy since the New Deal. He was a member of Reagan's Economic Policy Advisory Board.

His work in consumption analysis, monetary history and stabilization policy earned him the Nobel Prize in economics in 1976.
Whether they agree or disagree with Friedman's economic prescriptions, I think that nearly every economist in the world would acknowledge that he was a giant in the field. Friedman's own work - as well as the voluminous work done as a direct reaction to his work - played a huge role in shaping the field of economics, and in changing our understanding of the powers and limitations of economic policy-making.

Inflation Update, October 2006

This week we were treated to new inflation data by the BLS. The PPI report and the CPI report both showed dramatic falls in the rate of inflation, driven mainly by lower oil prices. But both reports indicated that inflation in other (e.g. non-oil) types of goods and services is also falling. The picture below illustrates.


By almost any measure of inflation you look at, the rate of inflation seems to have already passed its peak and begun falling. This was, of course, exactly what the Fed hoped to acheive by raising interest rates steadily for the past two years. Economic growth in the US has slowed, and the ability of firms to raise prices has been reduced along with it.

The Fed has also been lucky that oil prices have fallen considerably in recent months, of course. Together, the slowing economy along with lower oil prices have spelled a dramatic change in the inflation picture over the past few months - and may have rendered the Fed's concern about inflation obsolete. Discussion about the Fed raising interest rates further thus seems premature at best, and possibly downright foolish. To me, this picture is one of the best indicators yet that the economy began to soften significantly during 2006.

The real question is this: how slow will the economic slowdown go?

Tuesday, November 14, 2006

Economic Growth in the Euro Zone

It looks like the economy of the EU may actually experience faster growth than the US economy in 2006, for the first time in several years. New data out today from Europe indicate solid growth there. From the Wall Street Journal:
BERLIN – The euro-zone economy grew by 0.5% in the third quarter, less than forecast but enough to keep the region on course for its strongest economic expansion in six years.

France's surprise stagnation last quarter weighed on the 12-nation euro zone's overall growth rate, which economists had expected to be about 0.7%.

Strong growth in Germany, which expanded 0.6% from the previous quarter, and Spain, where quarterly growth hit 0.9%, propped up the overall figure for the euro zone. Spain's economy continued to be driven mainly by consumer spending and construction, while Germany's government said exports, business investment and consumer spending all contributed to growth.

Economists said the euro zone's slight slowdown last quarter may have been a partial correction from particularly strong growth in the second quarter, when the region's economy expanded by 0.9%, unusually fast by European standards.

The latest growth data, combined with strong business surveys, still back up the European Central Bank's view that the 12-nation currency area is heading for growth of around 2.5% this year, the region's fastest pace of growth since 2000. The ECB is widely expected to raise its key interest rate by a quarter point to 3.5% next month.
Another couple of interest rate hikes by the European Central Bank seem entirely possible. Coupled with some possible (or even likely) cuts in interest rates in the US next year, we could well see short-term US interest rates drop below European rates in 2007.

Monday, November 13, 2006

Ups and Downs

Sometimes the juxtaposition of two stories can tell more than the two tell us individually. From CNN/Money:
CEO: Ford ahead of schedule on layoffs

DETROIT (Reuters) -- Ford Motor Co. is "a little bit ahead" of schedule in settling buyout offers with its 75,000 unionized factory workers, the automaker's chief executive told the Detroit Free Press in an interview published Saturday.
And from the Wall Street Journal:
Toyota Races to Rev Up Production For a Boom in Emerging Markets

Toyota Motor Corp., already in a frenzied push to expand its auto output, is stepping up its race to open new factories as part of a confidential blueprint to grab a 15% global market share by 2010 amid an expected surge in car sales in India, China and other emerging markets.

The Japanese auto giant, which recently passed Ford Motor Co. to become the world's No. 2 auto maker by sales and is poised to overtake General Motors Corp. as early as this year, aims to open three more new plants by 2009 as part of a "global master plan," boosting its production capacity by 450,000 vehicles a year.
It's nothing we haven't heard about before. But still.

Monday, November 6, 2006

Reading the Polls

Okay, I admit it. Over the past couple of weeks, I've become addicted to polls. I find myself checking Pollster.com every day or two to see the latest poll results for the Senate and House races. I find myself thinking about the chances that the Democratic Party will win a majority in the Senate (pretty slim, I think) and the House (very good).

The following picture from a post on Pollster by Charles Franklin is a neat way to think about those probabilities.
Reading this picture takes a little practice. The black line is the easiest part to understand. It represents the average probability that the Democratic candidate will win any particular race given average poll results.

So for example, if the Democratic candidate is trailing by 5 points, then in 2000-02 the Democrat won the election about 30% of the time. But if the Democratic candidate was ahead in the polls by about 5 points, then they won more than 70% of the time. A lead in the polls of 10 points meant that the Democratic candidate won over 90% of the time.

Note that this suggests that the "margin of error" reported with polls applies to the support received by each candidate, not to the difference between the two candidates. Thus, if a poll reports a margin of error of 4% (which is typical), that means that the support for either candidate could be higher or lower by 4% - which means that the difference between them could be higher or lower by 8%. That's my interpretation for why the polls only tell us the winner with 95% confidence if the difference in support between the two candidates was at least 8 or 9%.

Being curious, I compared these probabilities with current polling in the Senate races. They indicate a 95% chance that the Democrats take Ohio and Pennsylvania, an 80% chance that the Democrats take New Jersey and Rhode Island, and a roughly 70% chance that they take Maryland and Montana.

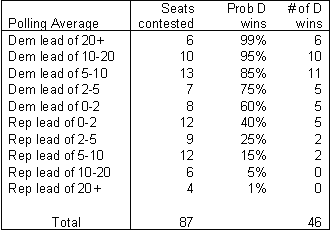
If we take a look at the House, we can use these probabilities to form an estimate of how many seats the Democratic party is predicted to gain. For example, according to Franklin's results, in races where the Democratic candidate is ahead in the polls by, say, 5-10 points, the Democratic candidate wins about 80% or 85% of the time. In races where the Democratic candidate is ahead by 2-5 points, the D wins about 70% of the time, and so forth. The following table summarizes.


Since 15 of these 87 seats listed by Pollster.com (from where I took these poll averages) are currently held by Democrats, these results predict a net gain for the Democratic party in the House of 31 seats.

There's one big caveat that needs to be applied to this reasoning, however. Franklin's analysis assumes that each race is statistically independent from the others. That, of course, is rarely true; if a close contest breaks in favor of one particular party, chances are that other close contests will also break in favor of that party, if for no other reason than that there are national factors affecting election outcomes across states.

So what does this mean? I think a net gain of 31 seats for the Democrats is a good starting point for an estimate, but it's quite likely that the true result will either be substantially higher or lower. How's that for hedging my bets?

If I had to pick numbers, though (and I don't, but what the hell), I'd say:
Senate: D +5 (OH, PA, RI, MT, VA)
House: D +22

On Wednesday we can start talking about why I was so wrong...

Friday, November 3, 2006

A Textbook Example...

Greg Ip has an interesting piece in today's Wall Street Journal:
Fed Official Says Bad Data Helped Fuel Rate Cuts, Housing Speculation

In an apparent and rare in-house critique, the president of the Federal Reserve Bank of Dallas said that because of faulty inflation data, the Fed kept interest rates too low for too long earlier this decade, fueling speculative housing activity.

...Mr. Fisher said from 2002 to early 2003, inflation, as measured by the price index of personal consumption expenditures (PCE) excluding food and energy, was running below 1%. That suggested that a serious shock to the economy could turn inflation to deflation, or generally falling prices... To reduce the risk of deflation, the Fed lowered its target for the Fed funds rate -- charged on overnight loans between banks -- to 1% in June 2003 and held it there until mid-2004. It has since raised it to 5.25%.

Mr. Fisher noted that subsequent revisions show PCE inflation was actually a half a percentage point higher than originally estimated. "In retrospect, the real Fed funds rate turned out to be lower than what was deemed appropriate at the time and was held lower longer than it should have been," Mr. Fisher said.
This seems like a pretty good description of the situation. But it's nothing that economists haven't known about for a long time. Just look up the term "recognition lag" in any intro macro textbook, and you'll see a description of exactly this phenomenon.

It's nice to see that the things we teach our students actually happen in real life. Except, of course, when those things mean that monetary policy may have made some serious mistakes that might have lasting negative repercussions on the economy...

Slowing Job Creation

The US economy continued its sluggish pace of job creation in October. From this morning's BLS news release:
Employment increased in October, and the unemployment rate declined to 4.4 percent, the Bureau of Labor Statistics of the U.S. Department of Labor reported today. Nonfarm payroll employment grew by 92,000 in October following gains of 148,000 in September and 230,000 in August (as revised). In October, job growth continued in several service-providing industries, while employment declined in manufacturing and construction. Average hourly earnings rose by 6 cents over the month.
This is disappointing news, though it was tempered a bit by sizeable upward revisions to the previous two months' employment gains. Nevertheless, the 92,000 net new jobs created in October was substantially below expectations, particularly since only 58,000 were in the private sector (the rest were in government); the expectation for total job creation had been for closer to 130,000. Atrios wins yet again!

At any rate, it still seems that the pace of job creation in the US has cooled a bit in recent months. The picture below shows the 6-month average job creation over the past 10 years.


As many economists have commented about previously, the best job creation of this economic expansion was never nearly as good as during the previous expansion. But even the modest job creation of the past few years seems to be slowing down now.

By the way: if you think that this slowdown in job creation is exclusively the fault of the construction industry, think again. As the following picture shows, nearly every industry in the economy - except for the government - has created fewer jobs over the past 6 months than it did over the previous 6-month period.


The housing sector may be leading the economy toward slower growth. But the rest of the economy seems to be joining in, too.

Thursday, November 2, 2006

Is the Great Productivity Boom Over?

This morning the BLS released its estimates of third quarter productivity growth and labor costs. From the news release:
Productivity in the nonfarm business sector remained unchanged during the third quarter of 2006. Output grew at a 1.6 percent annual rate. Hours of all persons in the nonfarm business sector also increased 1.6 percent, reflecting 0.8-percent gains in both employment and average weekly hours at work. In the second quarter, nonfarm business productivity increased 1.2 percent, as output grew 2.7 percent and hours worked rose by 1.5 percent.

Hourly compensation increased at a 3.7 percent annual rate in the third quarter of 2006. When the rise in consumer prices is taken into account, real hourly compensation rose 0.7 percent during the July-September period. During the second quarter of 2006, real hourly compensation had increased 1.6 percent.
So, does this mean that the great productivity boom of that past several years is over? It's sure beginning to look that way. Take a look at this picture, which shows the 24-month change in productivity in the nonfarm business sector since 1995.


After years of average productivity growth in the range of 2.5% - 3.5% per year, productivity growth has clearly been trending down since late 2004, and over the past two years productivity has grown at an annual rate of just under 2%.

Part of this slowdown in productivity growth surely has something to do with the US now being in the late stages of this business cycle; productivity typically rises most in the early stages of an economic expansion, and rises least in the expansion's late stages. But since we didn't follow that pattern during the last recession (productivity kept booming as the economy slowed down in 2000 and 2001), it gets more difficult to write off the current slowdown in productivity growth as simply a matter of being at the wrong place in the business cycle.

One last note: the compensation that workers are receiving for their production has still not caught up from the substantial divergence that we saw from 2001-05, as the picture below illustrates.


The huge productivity gains enjoyed by the US economy from 2001-05 went almost entirely to the owners of corporations, not to workers. That was very unusual, by the way; normally real compensation tracks productivity quite closely (for a picture of what I'm talking about see this old post from Angry Bear). But for some reason, that relationship broke down during the first five years of this decade. Recent gains in compensation mean that the gap between worker productivity and compensation is at least not getting any larger; however, it's not really getting much smaller either.

That may be yet another reason for average Americans to feel that the current economic expansion has left something to be desired.

When is a Dollar Not Worth a Dollar?

Apparently, the answer is: when it's more than five years old, and trying to be used in a developing country. From an interesting story in today's Wall Street Journal:
ANTANANARIVO, Madagascar -- Once a month, Jean Yves, a cabin attendant on an Italian cruise ship, gets in line at the purser's office to collect his pay -- seven $100 bills.

If he's lucky, the bills will indeed be worth $700 when he arrives in port and tries to spend them. If he isn't, they'll be worth closer to $600. The difference? The good bills are new ones that bear Treasury Secretary John W. Snow's signature. The bad ones are signed by Treasury Secretary Robert E. Rubin.

...In many countries, from Russia to Singapore, the dollar's value depends not just on global economic forces that move international currency markets, but also on the age, condition and denomination of the bills themselves. Some money changers and banks worry that big U.S. notes are counterfeit. Some can't be bothered to deal with small bills. Some don't want to take the risk that they won't be able to pass old or damaged bills onto the next person. And some just don't like the looks of them.
Okay, I'm not too sure that the last factor has much to do with the discount on older US currency, since I'm sure if it were just a matter of taste for some people who don't like the looks of the older currency, then there would be others who would be willing to trade in the "unattractive" currency anyway to make some money. But still, the phenomenon is interesting.

By the way, it's also worth noting that suspicion of older notes in developing countries is a perfectly rational thing to do, if the circulation of counterfeit bills is much more common in those countries. No one wants to be the last one holding a fake bill, after all. Which is why those currency traders in the developing world may be among the greatest beneficiaries of the new and more counterfeit-proof bills introduced in the US in recent years.

Wednesday, November 1, 2006

Telling the Future with Interest Rates

Barry Ritholtz points us to a post in yesterday's WSJ Marketbeat about how the markets' optimism about the direction of the US economy seems to be changing.

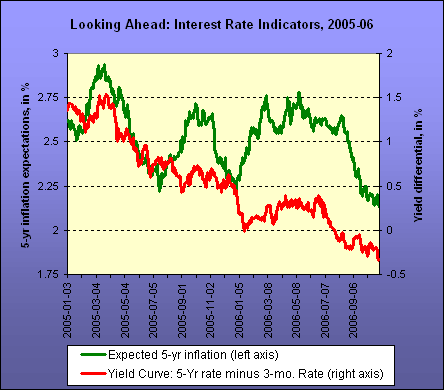
I think they're right. As an illustration, let me show you two interest rate series that tell us something about market participants' expectations.


The red line in the picture below shows the difference in the yield curve between interest rates on 5-year government bonds and 3-month treasury bills. In the past few months that yield differential has moved decidedly negative, meaning that people are willing to accept a lower rate of interest when lending money for 5 years than they will accept to lend money for 3 months.

If you think (pretty reasonably) that the only reason you'd ever accept a lower rate of interest on a loan you were making for 5 years would be to lock in that rate for a long period of time in the face of falling interest rates, then this series tells us that the market expects interest rates to drop. (For more about what the yield curve tells us, see the blogosphere's resident expert on the subject, Jim Hamilton, or this handy primer from the NY Fed.)

Economists have developed models to gauge the probability of recession based on the yield differential. A neat tool over at Political Calculations (hat tip: Jim Hamilton) uses the predictive model of economist Johnathan Wright to calculate the probability of recession. If you plug today's interest rates into that calculator, it tells us that there's a 52% chance that we'll have a recession sometime in the next 12 months. That's a pretty high chance.

The green line in the chart tells us something else: what market participants expect inflation to be over the next 5 years. That series is calculated by subtracting the inflation-adjusted TIPS interest rate from the interest rate on the nominal 5-year government bond. (Yes, there's a little bit of error because the TIPS market is not very liquid, but it still gets us pretty close to average inflation expectations.)

The thing to notice in that series is how sharply inflation expectations have changed over the past few months. It seems likely that that reflects a new feeling in the market that the economy is about to slow down significantly. Of course, the series also shows how volatile those inflation expectations are (or how big of an impact liquidity issues have on the TIPS market, depending on your interpretation), so take that data with a grain of salt. But it still seems pretty clear that along with expectations of lower interest rates, the bond market seems to be expecting lower inflation sometime soon.

Put those two together, and this picture tells me that market participants think there's a pretty good chance of a dramatic slowdown in the US economy happening pretty soon. Reading the tea leaves of today's interest rates, the future looks a little bleak.