The following picture from a post on Pollster by Charles Franklin is a neat way to think about those probabilities.

Reading this picture takes a little practice. The black line is the easiest part to understand. It represents the average probability that the Democratic candidate will win any particular race given average poll results.
So for example, if the Democratic candidate is trailing by 5 points, then in 2000-02 the Democrat won the election about 30% of the time. But if the Democratic candidate was ahead in the polls by about 5 points, then they won more than 70% of the time. A lead in the polls of 10 points meant that the Democratic candidate won over 90% of the time.
Note that this suggests that the "margin of error" reported with polls applies to the support received by each candidate, not to the difference between the two candidates. Thus, if a poll reports a margin of error of 4% (which is typical), that means that the support for either candidate could be higher or lower by 4% - which means that the difference between them could be higher or lower by 8%. That's my interpretation for why the polls only tell us the winner with 95% confidence if the difference in support between the two candidates was at least 8 or 9%.
Being curious, I compared these probabilities with current polling in the Senate races. They indicate a 95% chance that the Democrats take Ohio and Pennsylvania, an 80% chance that the Democrats take New Jersey and Rhode Island, and a roughly 70% chance that they take Maryland and Montana.
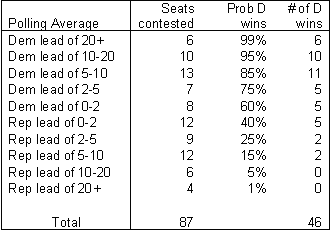
If we take a look at the House, we can use these probabilities to form an estimate of how many seats the Democratic party is predicted to gain. For example, according to Franklin's results, in races where the Democratic candidate is ahead in the polls by, say, 5-10 points, the Democratic candidate wins about 80% or 85% of the time. In races where the Democratic candidate is ahead by 2-5 points, the D wins about 70% of the time, and so forth. The following table summarizes.

Since 15 of these 87 seats listed by Pollster.com (from where I took these poll averages) are currently held by Democrats, these results predict a net gain for the Democratic party in the House of 31 seats.
There's one big caveat that needs to be applied to this reasoning, however. Franklin's analysis assumes that each race is statistically independent from the others. That, of course, is rarely true; if a close contest breaks in favor of one particular party, chances are that other close contests will also break in favor of that party, if for no other reason than that there are national factors affecting election outcomes across states.
So what does this mean? I think a net gain of 31 seats for the Democrats is a good starting point for an estimate, but it's quite likely that the true result will either be substantially higher or lower. How's that for hedging my bets?
If I had to pick numbers, though (and I don't, but what the hell), I'd say:
Senate: D +5 (OH, PA, RI, MT, VA)
House: D +22
On Wednesday we can start talking about why I was so wrong...
No comments:
Post a Comment