Friday, December 22, 2006

Oil Industry Subsidies

The subsidies that the US government extends to the oil industry are in the news today, with the following story from the New York Times:
Study Suggests Incentives on Oil Barely Help U.S.

WASHINGTON, Dec. 21 — The United States offers some of the most lucrative incentives in the world to companies that drill for oil in publicly owned coastal waters, but a newly released study suggests that the government is getting very little for its money.

The study, which the Interior Department refused to release for more than a year, estimates that current inducements could allow drilling companies in the Gulf of Mexico to escape tens of billions of dollars in royalties that they would otherwise pay the government for oil and gas produced in areas that belong to American taxpayers.

But the study predicts that the inducements would cause only a tiny increase in production even if they were offered without some of the limitations now in place.
Clearly there are excellent political reasons for the oil subsidies - otherwise they wouldn't exist. But are there any good economic reasons for the federal government to subsidize the oil industry at all?

I think that the answer is probably no.

The answer, of course, depends on what you think are the nominal goals of the subsidies. I can think of a few candidates:
  • To reduce the price of oil for consumers by increasing overall oil production;
  • To earn fair market value from an asset that is owned by the citizens - the US's offshore oil deposits;
  • To support jobs in the domestic oil industry;
  • To reduce the US's energy dependence, by replacing imported oil with domestic production.
Clearly the oil subsidies fail to acheive the first goal. The US is such a marginal and expensive producer of oil at this point that it's inconceivable that any additional oil production encouraged by subsidies could possibly have any impact on the world price of oil.

The second goal is also clearly not acheived with the present level of subsidies to the oil industry. As the article points out, raising the price charged by the federal government to oil companies would have a negligible impact on the quantity of oil produced, but would have a significant impact on the dollars earned by the people of the US for that oil. Put another way, think of it as being on the left-hand side of the oil revenue Laffer curve; if we reduced the subsidies given to the oil industry (or increased the fees charged them), the American public would receive a lot more money for its oil assets than they currently do.

As far as supporting oil industry jobs goes, it's not at all clear to me why we would want to do that in the first place, as oppsed to jobs in any other industry in the US. But since the impact of the subsidies on production is so tiny, the impact on jobs is also certainly tiny. If the subsidies result in 1% more employment in the oil industry (to go along with the estimated production impact of about 1%), then the billions of dollars per year in subsidies support a total of about 1,400 workers. (There are currently 140,000 workers in oil and gas extraction, according to the BLS.) That's works out to be a cost to taxpayers of a few million dollars for each additional job in the oil industry.

So the most compelling rationale for oil subsidies must hang on the last potential goal: to make the US more energy independent. This is not, strictly speaking, and economic goal; it may have national security implications, but from an economic point of view it really makes no difference where the gallon of gas pumped into your car comes from.

But does it even have any impact on national security? That depends on how much of a reduction in imports of oil it would take to enhance US national security. Would it need to be a 10% reduction? 25%? 50%? I don't know the answer, but I do know that even increasing US production by 50% - a mammoth increase in production that would not be possible in any oil-man's wildest dreams - would only bring the US's dependence on imports down from about 65% to about 50%. I fear that trying to acheive energy independence through increased domestic US production is like trying to catch the end of an oily rainbow.

In short, I think it's easy to punch holes in every reasonable justification that one might encounter for subsidies for the oil and gas industry. There are many changes that a Democratic Congress may make to the federal government's tax and spending policies. But eliminating these subsidies would be one of the ones for which I would cheer the loudest.

Thursday, December 21, 2006

Final Revision of 3Q GDP

The BEA released their final estimate of third quarter GDP this morning. The Wall Street Journal reports:
The U.S. economy was a bit weaker during the summer than earlier believed as the sharpest housing-sector slump in 15 years took an even bigger toll on the slowest quarterly growth of 2006.

Gross domestic product rose at a 2% annual rate July through September, revised down from a previous estimate a month ago of 2.2% for the third quarter, the Commerce Department said Thursday.

Economists surveyed by Dow Jones Newswires had expected third-quarter growth to hold at 2.2%. The Commerce Department said the revision to GDP, a measure of all goods and services produced in the economy, mainly reflected a downward adjustment to consumer spending.

Consumer spending, the biggest component of GDP, rose 2.8%, down from a previously reported 2.9% increase but above the second quarter's 2.6% advance. Consumer spending accounts for roughly two-thirds of economic activity. It contributed 1.96 percentage points to GDP in the third quarter.

Another GDP component that was lowered was residential fixed investment, which plunged 18.7% in the third quarter instead of the previously reported 18.0%. Housing is bogging down the economy, which grew at a faster, 2.6% rate in the second quarter and 5.6% pace in the first three months of 2006. The drop in residential fixed investment was the sharpest since a 21.7% drop in first-quarter 1991, and cut 1.20 percentage points off of GDP. Second-quarter residential fixed investment dropped by 11.1%.
Yes, the slowdown in housing construction is having a direct impact on the growth of the US economy. But I'm actually much more worried about the eventual effects that flat or falling home prices could have on household balance sheets in most of the US's previously hot housing markets.

Put this together with the precarious financial situation of millions of US households, many of which may be facing default and eventual foreclosure over the next year or two, and I fear that the effects on personal consumption in 2007 could be substantially bigger than the direct impact on the economy of reduced home building.

Wednesday, December 20, 2006

Adventures in Capital Controls

Thailand has been in the news over the past couple of days because of the fun and games they've been playing with the imposition of capital controls. (Of course, to investors in the Thai financial markets who may have lost lots of money in recent days, it may not seem like fun and games...)

In brief, the story is this: Thailand's currency has been slowly appreciating in recent years... but the pace of that appreciation has increased noticeably in recent months, as illustrated in the picture below (note that downward movement indicates a weaker dollar, and stronger baht).


Like practically everyone else in Asia, Thailand is not too keen on their currency getting stronger, because they don't want their exports to suffer. So, they've been doing some intervention in the foreign currency markets to keep the baht from appreciating too much, as the next picture illustrates.


Obviously, those interventions have not been sufficient to prevent a growing rate of baht appreciation of late. But it's also worth noting that Thailand has not been buying nearly as many dollars as many other Asian countries, such as Malaysia ($80bn in foreign currency reserves), Singapore ($135bn), India ($170bn), Korea ($235bn), Taiwan ($265bn) and China ($1,000bn).

So instead of ramping up their purchases of dollars in the foreign exchange markets, the Thai central bank hit upon the idea of imposing capital controls, effectively taxing capital inflows into Thailand. The idea is that if money from around the world stops flowing into Thailand (which has presumably been happening because international investors think that they can earn capital gains by holding baht assets as the baht appreciates), then that will relieve the pressure on the baht to appreciate.

The problem is that the stock market in Bangkok didn't like that idea very much. It dropped 15% yesterday. Under intense pressure from Thai financiers, the Bank of Thailand then partially reversed course yesterday, allowing the stock market to recover partially on Wednesday. Bloomberg reports:
Dec. 20 (Bloomberg) -- Thai stocks rallied from the biggest slump in 16 years after the military-led government scrapped restrictions for international investors that roiled shares in emerging markets.

The SET Index jumped 11 percent to 691.55 at the close, its biggest gain since Feb. 2, 1998. It was the largest fluctuation among equity markets included in global benchmarks. Yesterday's 15 percent drop erased $23 billion in market value, prompting the government to rescind penalties on equity investors who don't keep their funds in the country for a year.

The policy reversal, a day after the new rules were announced, damages the credibility of Thailand's three-month-old government, led by former army chief Surayud Chulanont. International investors had increased stock purchases since a Sept. 19 coup ended seven months of political turmoil that disrupted government spending and dented consumer confidence.

"It makes investors doubt these people can manage the country," said Jorry Noeddekaer, who helps manage $1.4 billion of Asian stocks at New Star Asset Management Ltd. "It would take a lot of good moves to rebuild credibility."
The capital controls in place now are probably next to useless as a way of reducing capital inflows into Thailand. Any investor who wants to bet on an appreciating baht can still do so via the stock market. And a clever financial firm should have little difficulty making investments in the Thai bond market (which are nominally still subject to the capital controls) look like they are investments in stocks (which are not).

Ironically, the Thai central bank's screwy policy enactment and reversal will probably still have the desired effect. As the Bloomberg story quoted above notes, the erratic and investor-unfriendly tendencies that the Bank of Thailand demonstrated will certainly have the effect of dampening investor enthusiasm for Thai assets.

So despite their clumsiness, the Thai central bank has probably achieved their desired goal after all - just not how they originally intended to. It's a very expensive way to do it, but central bank foul-ups are always a good way to make people stop buying your currency.

Just ask Mexico.

Tuesday, December 19, 2006

Exaggerated Inflation Worries

Today's PPI report has led to some rather excessive fears about inflation this morning. Marketwatch reports:
WASHINGTON (MarketWatch) - Producer prices soared in November at the fastest pace in decades, pushed higher by rebounding energy prices and a quirky gain in car and truck prices.
The November producer price index climbed by 2%, the biggest rise since 1974, the Labor Department reported Tuesday. The PPI had fallen 1.6% in October.
If that makes you nervous, take a look at the following picture, which shows how the core and overall PPI have behaved this year.


Doesn't look so bad now, does it? It seems that October's figures were a bit of an aberration, and November's data simply corrected them. Over the past 12 months, the core PPI is up 1.8%, which is typical for 2006; with the exception of the odd behavior in the PPI over the past couple of months, the 12-month change in core producer price inflation has fluctuated between about 1.5% and 2% for the past year.

The moral of the story: don't take one month's data too seriously.


UPDATE: See Dean Baker for some similar sentiments, though with the opposite reading for what this erratic PPI data means about inflation.

Monday, December 18, 2006

Talking Exchange Rates

Menzie Chinn and I share some of our thoughts in this week's Wall Street Journal Econoblog. As you can see by scrolling down through my posts this month, it's a topic that's been on my mind a lot lately.

Enjoy, and feel free to share your thoughts.

Is the Yuan Exchange Rate a Subsidy?

The other day Nouriel Roubini pointed out how dangerous he thought Ben Bernanke's flirtation with the word "subsidy" in a speech in China last week was. As Mark Thoma (see also Menzie Chinn, among others) noted last week, the text of Bernanke's speech in Beijing called the yuan peg (which is more accurately a crawling peg) against the dollar an "effective subsidy". However, Bernanke spontaneously reworded that description to "distortion". Originally, his speech read like this:
Greater scope for market forces to determine the value of the RMB would also reduce an important distortion in the Chinese economy, namely, the effective subsidy that an undervalued currency provides for Chinese firms that focus on exporting rather than producing for the domestic market.
The problem with that language, as Nouriel points out, is that the word "subsidy" has a specific legal meaning which allows for specific legal retaliations, such as import tariffs. In fact, all members of the WTO have agreed to the following precise definition of what an export subsidy is:
For the purpose of this Agreement, a subsidy shall be deemed to exist if there is a financial contribution by a government or any public body within the territory of a Member (referred to in this Agreement as “government”), i.e. where:

(1)
  • a government practice involves a direct transfer of funds (e.g. grants, loans, and equity infusion), potential direct transfers of funds or liabilities (e.g. loan guarantees);
  • government revenue that is otherwise due is foregone or not collected (e.g. fiscal incentives such as tax credits);
  • a government provides goods or services other than general infrastructure, or purchases goods;
  • a government makes payments to a funding mechanism, or entrusts or directs a private body to carry out one or more of the type of functions illustrated in (i) to (iii) above which would normally be vested in the government and the practice, in no real sense, differs from practices normally followed by governments;
or

(2) there is any form of income or price support [which operates directly or indirectly to increase exports of any product from, or to reduce imports of any product into, its territory].
Clearly, China's exchange rate regime does not qualify under the first set of criteria. The only way one could consider it a subsidy is if one argued that it constituted a form of price support, under the second criterion. But it's hard for me to see how a fixed exchange rate could be interpreted as a "price support", since the exchange rate says absolutely nothing about what price producers will receive for the goods they sell. All it does is guarantee the price everyone will receive if they sell one currency in exchange for another.

Moreover, the very first line of the definition of a subsidy states that there must be a financial contribution by the government to the firms that benefit. China's fixed exchange rate does not involve any such financial contribution. Maintaining the peg merely involves a change in the composition of the PBoC's balance sheet - it holds more yuan liabilities and more dollar assets. So I can't see how a fixed exchange rate regime could conceivably be equated with the definition of a subsidy that the US (and every other WTO signatory) has already agreed to.

But suppose that you wanted to rewrite the definition of "subsidy". That causes its own set of problems. In particular, I think it would be impossible to find any broadly-accepted criteria to define when a fixed exchange rate is a subsidy.

Lots and lots of countries have had fixed exchange rates, including scores of countries today, and nearly every country (including the US) at some point in the past. Were they all providing a subsidy to their exporters? Clearly not. So how do you tell when a fixed exchange rate is a "subsidy"?

Does it depend on whether a country has a current account surplus? Should we stipulate that any time a country has a current account surplus, together with a fixed exchange rate, it is subsidizing its exports? Well, in that case we would have to include lots of other countries around the world that have current account surpluses and fixed exchange rates. Thailand and Malaysia, for example, and Venezuela, and most of the Persian Gulf countries, all have fixed exchange rates and current account surpluses much bigger than China's. Germany, Belgium, and the Netherlands all have a fixed exchange rate (known as the euro) with most of their major trading partners, and substantial current account surpluses. Even the US had a fixed exchange rate along with regular current account surpluses through most of the 1950s and 60s. In fact, one could come up with literally hundreds of examples over the past 50 years where a country has met those conditions. Were all of those instances examples of "effective subsidies"?

Maybe some different criteria would work better. Maybe a country is only providing an "effective subsidy" to its exporters if it has a fixed exchange rate and is accumulating foreign reserves to maintain the peg. But by that criteria, nearly every country in the world with a fixed exchange rate qualifies, since nearly every country in the world has been gaining foreign currency (mainly dollar) reserves in recent years. Many African countries have been gaining foreign reserves at an even faster clip than China has, in fact (though they're much, much smaller, so in absolute terms their gains are tiny by comparison to China's reserve increases).

In other words, I don't think that there are any reasonable, objective criteria that could be agreed on to decide whether a country's fixed exchange rate qualifies as an "effective subsidy" to its exporters. And as Nouriel wrote, without a generally accepted definition of when exchange rate management should be considered a subsidy, there would be literally scores, if not hundreds, of possible accusations of countries "subsidizing" their exporters, and no way to adjudicate between the frivolous cases and the ones with merit.

In short, I'm glad that Bernanke pulled back from using the word "subsidy" in his remarks. But I'm dismayed that he came as close as he did to opening that Pandora's Box.

Friday, December 15, 2006

More Cause and Effect Regarding the Current Account

Thanks to PGL for alerting me to this post by Steve Kyle, now at Angry Bear. Steve refers us to comments by Dean Baker, in which Baker argues that a yuan revaluation against the dollar is essential to any improvement in the US current account balance - higher savings in the US will not be enough to do it.

PGL points out that one can really think of this is a question of cause and effect (otherwise known as a chicken-or-the-egg debate). Would a cheaper dollar induce higher savings, thus bringing about the needed change to the US's savings/investment balance that would reduce the CA deficit? Or would an improvement in US savings cause the dollar to lose value, thus inducing US exports to rise and imports to fall and thereby improving the CA deficit?

Obviously, exchange rates and domestic consumption/savings behavior are both jointly and simultaneously determined. But if I had to pick one to be more exogenous, I would vote for savings behavior. I think that the US's underlying savings/investment balance has a lot more influence over the dollar exchange rate than the other way around. Dean suggests the opposite, and specifically argues that because the weak yuan has entailed the Chinese central bank buying lots of dollars, the Chinese exchange rate policy has effectively kept interest rates low in the US, which in turn has depressed savings.

But I'm not convinced. While I agree that interest rates in the US are lower today than they would be without Chinese exchange rate intervention (not to mention intervention by lots of other central banks around the world, particularly among certain OPEC countries), I think that there's pretty weak evidence that savings behavior is affected much by interest rates.

As a quick look at what I'm talking about, it's worth simply plotting interest rates against the savings rate in the US, as I've done in the following picture. Both series show 6-month moving averages.


I think it's hard to see a clear relationship between interest rates and the savings rate in the US in this picture. Personally, I believe that personal saving as a fraction of disposable income (which is what the red line shows) depends a lot more on changes in household balance sheets than it does on interest rates. While we probably shouldn't take that notion too literally, it is an interesting coincidence that the two big drops in savings rates that we've seen over the past decade both coincided with the final, frenzied stages of dramatic asset price appreciations - in the stock market in 1999, and in the housing market in 2005.

But I don't want to pretend that I really understand household savings behavior. What I do want to argue is that I'm skeptical of the notion that a different yuan/dollar exchange rate will somehow make the US savings rate rise. At the same time, it's fairly easy for me to tell a story about how an improvement in the US savings rate would cause the US CA balance to rise. That's why, if I had to choose a necessary first step for an improvement in the CA deficit, I'd vote for a change in US savings behavior.

Falling Inflation

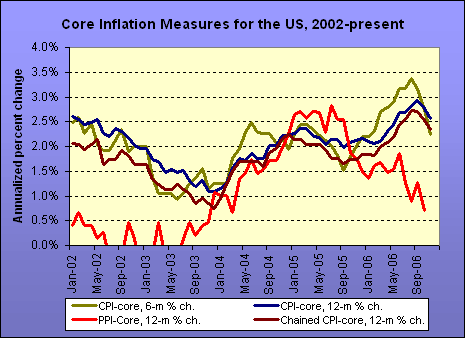
It's pretty unequivocal now, I think: the inflation rate in the US is clearly falling, even aside from the drop in oil prices that we've enjoyed recently. Today's BLS report on consumer price inflation adds to the data:
On a seasonally adjusted basis, the CPI-U was unchanged in November, following declines of 0.5 percent in each of the preceding two months. Energy prices, which declined sharply in September and October, fell 0.2 percent in November. Within energy, the index for petroleum-based energy decreased 1.5 percent while the index for energy services increased 1.2 percent. The food index decreased 0.1 percent in November. The index for all items less food and energy was virtually unchanged in November, following an increase of 0.1 percent in October. A 0.4 percent increase in shelter costs was partially offset by declines in the indexes for apparel and for the non-energy portion of the transportation index, particularly the indexes for new and used vehicles and for airline fares.
Here's the picture of inflation for things other than food and energy products:


This simplifies things for the Fed considerably. They no longer have to keep interest rates high to maintain their inflation-fighting credibility. Instead, they can focus their attention on cushioning the slowdown of the US economy in 2007.

Wednesday, December 13, 2006

Exchange Rate Data

I'll be Econoblogging with Menzie Chinn about exchange rates over the next day or two. As a reference (primarily for myself), I wanted to just put up a couple of pictures of various US dollar exchange rates.

The first shows the value of the US dollar against a few major trading partners over the past 5 years. Series are measured as an index such that a lower index number indicates a weaker dollar, and the average exchange rate for 2003 is set equal to 100 for each series. Note that the trade-weighted exchange rate is the broad index calculated by the Federal Reserve, and that data goes up to December 12, 2006.


The next picture shows a closeup of exchange rate movements over the past year. To better show recent movements in each exchange rate, I've recentered each series around its June 2006 value, which is set to 100.


Interesting...

Tuesday, December 12, 2006

US Exports and Imports

We have new data today on the US's exports and imports from the BEA. CNN/Money reports:
NEW YORK (CNNMoney.com) -- The nation's trade deficit tumbled in October on lower prices for oil imports, but the gap with China kept growing ahead of a key trip to that country by Treasury Secretary Henry Paulson, Federal Reserve Chairman Ben Bernanke and other top officials.

Overall, imports topped exports by $58.9 billion in October, down from $64.3 billion in September, the Commerce Department reported. Economists surveyed by Briefing.com had forecast a much smaller decline, to $63 billion.

But the deficit widened with China, which runs by far the biggest trade surplus with the United States of any other country.

The report comes as Paulson, U.S. Trade Representative Susan Schwab and other officials left for China for meetings that are sure to bring up some contentious trade issues. Bernanke is due to join them after Tuesday's meeting of the Fed policymakers.
China is on everyone's mind these days, and as a result, almost all international economic news is now viewed through the China lens. As this news excerpt mentions, the trade deficit with China does indeed continue to widen even as the overall US trade deficit seems to have peaked (at least temporarily).

But it's worth noting that simply looking at the US trade deficit with China is a bit misleading. In fact, US exports to China have been growing much faster than US imports from China. The problem is, of course, that the levels of exports and imports are very different, so US exports would have to grow much much faster than imports in order for the US trade imbalance with China to stop rising.

The following tables show how US exports and imports have changed in 2006 compared to 2005. First, let's take a look at changes by trading partner:


US exports to nearly all of the US's trading partners have grown solidly over the past year, but exports to most of the developing world - including China - have done particularly well. Interestingly, the parts of the world that seem to be lagging in terms of US export growth are the rest of east Asia, such as Japan, Taiwan, and Korea.

The next table shows changes in US imports and exports by type of product:


Obviously, a huge chunk of the increase in US imports is oil. The interesting thing to notice in this table is that US imports of consumer goods have actually grown relatively slowly over the past year. Meanwhile, exports have grown soidly in the US's traditional strengths: capital goods (things like machinery, telecommunications equipment, and aircraft) and industrial supplies (things like chemicals, wood and paper products, metals, etc.).

Meanwhile, Treasury Secretary Paulson heads to China to try to work some magic on the US trade deficit. The pressure on him to do so is substantial. But short of somehow managing to get Chinese consumers to do more spending and US consumers to do less of it, I think he has little chance of actually accomplishing that goal.

Monday, December 11, 2006

Too Many Yuan

Interesting news from China today, via the Wall Street Journal:
SHANGHAI -- China's central bank said it plans to absorb about $20 billion in cash in its latest effort to keep its economy from overheating. The move is meant to rein in lending without raising interest rates and to reduce liquidity in the country's financial system.

The People's Bank of China said Friday it plans to sell banks about 160 billion yuan, or $20.45 billion, of one-year bills in the yuan money markets today. The bills will yield 2.7961%. By placing the debt instruments with commercial banks, Beijing is reducing the amount of money banks have available to lend.

...China's government is concerned too much cash in bank coffers will encourage bankers to boost lending. The risk of too much lending is either inflation, as the lending sparks economic growth, or losses for banks if the loans go bad. The buildup of cash comes from China's exports, which are pulling dollars into the Chinese financial system. Exporters then spend their earnings after converting their money into yuan.
In a sense, this is not a dramatic change for the PBOC; it has been issuing "sterilization bonds" for years in order to mop up some of the extra yuan generated by its actions to keep the currency pegged against the dollar.

But in another sense, this news is quite interesting. That's because a bond issue of this size indicates that the financial pressure may be building on the PBOC to use the next obvious tool that would reduce the amount of yuan floating around in the Chinese economy: to allow the yuan to appreciate faster against the US dollar. I'm sure that there is quite a bit of ongoing discussion about this very subject within the halls of the PBOC...

Thursday, December 7, 2006

Bernanke and the Democratic Congress

Bloomberg has an interesting piece today about the sort of questions and discussion that Ben Bernanke may get at his next appearance on Capitol Hill:
Dec. 7 (Bloomberg) -- Federal Reserve Chairman Ben S. Bernanke may be heading for a showdown with congressional Democrats over his warning that wage gains risk causing a jump in inflation.

Fed policy makers are threatening to raise interest rates should inflation remain elevated, even as the housing slump slows the economy. Democrats, led by incoming House Financial Services Committee Chairman Barney Frank, vow to grill Bernanke over borrowing costs and wage increases that have lagged behind profit growth under President George W. Bush's administration.
Personally, I'm all for more intense - and even critical - questioning of Bernanke on Capitol Hill. I think that Bernanke is a fantastic economist, and in ten years I expect to be able to describe him as a first-rate central banker. But that's exactly why I think it would be a very good thing for him to have to explain his understanding of the economy - including the dangers of wage inflation, the effects of the minimum wage, the phenomenon of widening income inequality, the US-China financial relationship - to the rest of us.

There are a lot of difficult and important economic issues out there right now. Who better than Bernanke to help stimulate discussion and contribute to the public debate about them?

Euro Growth

Interest rates are rising in Europe. From The Economist today:
The European Central Bank raises interest rates to 3.5%, as the euro continues to nudge up against the dollar

[T]he ECB chose to raise interest rates another quarter of a percentage point, to 3.5%, at its monthly meeting on Thursday December 7th. It was the sixth such increase in the past year, as the export led recovery has slowly spread to other sectors in the euro zone.
Naturally, rising interest rates in Europe tend to reinforce the recent trend of the euro getting stronger against the dollar. The last time the euro/dollar exchange rate was at this level, in 2004 and early 2005, the European Central Bank seemed rather unhappy about it. But perhaps not this time.
The bank isn’t quite as uncomfortable with a rising euro as it used to be: unlike 2004, there has been no attempt to talk the euro down. This time around the recovery seems solid enough to withstand (and even contribute to) a dearer euro. Europe's economy is looking more self-sufficient these days. Companies are finally starting to invest their export profits in domestic expansion, particularly in Germany. Even consumption, previously weak, has finally started to look a little less wan.
Indeed, the European economy seems to be on a reasonably strong trajectory right now, and GDP growth will probably be close to 3% in the euro-zone in 2006, compared to GDP growth in the US of perhaps 2.5%. Note that on a per-capita basis, 3% GDP growth in Europe would be equivalent to almost 4% GDP growth in the US - a very respectable rate of economic growth, indeed.

Tuesday, December 5, 2006

The Disappearing Inflation Problem

Today's most interesting data news: wage and salary payments to workers in 2006 now appear to have been far, far lower than were previously estimated. The Wall Street Journal reports on today's new data from the BLS:
Labor Costs Revised Lower As Productivity Grows 0.2%

WASHINGTON -- U.S. productivity growth was mildly stronger during the summer than first thought, while unit labor costs were revised sharply lower for two quarters in a favorable sign for inflation.

...Third-quarter unit labor costs -- a gauge of inflationary pressures -- rose by 2.3%. Economists expected a 3.2% advance. [The BLS] originally estimated a 3.8% increase for the third quarter. Unit labor costs in the second quarter decreased, falling 2.4%; originally, Labor reported a 5.4% surge.

Compared to a year earlier, unit labor costs were 2.9% higher; in Labor's last productivity report, it estimated the year-over-year climb at 5.3%.
That's a big, big difference; whereas a week ago it looked like the cost of labor had risen by more than 5% over the past year (a fact stridently noted by many inflation hawks, including members of the Fed), now it appears that labor costs have actually only been rising by just over half that rate. Note that unit labor costs are of great importance to inflation-watchers because they describe how firms' costs are changing (labor being the biggest single cost of most firms).

Note that this sharp change in the inflation picture was actually foretold by last week's GDP revision. In that revised GDP report, wages and salaries were about $100 billion lower in early and mid-2006 than had previously been estimated, as Rex Nutting of Marketwatch reported.

The following picture shows what the most up-to-date earnings data looks like. The green line shows real compensation, which is the data that matters from the point of view of workers. The red line shows unit labor costs, which is how that compensation affects the costs of firms (taking into account changes in worker productivity). This latter line is the one that concerns inflation-watchers. A 2.9% rise over the past 12 months sure looks a lot less worrying than a 5%+ increase did.


So today's data can join the growing queue of reports (see today's column by Irwin Kellner for more examples) suggesting that inflation is not the major problem that the US economy is facing today; rather, a significant slowdown in economic growth seems to be becoming the much more pressing danger.

Monday, December 4, 2006

House Price Changes in the US

The Office of Federal Housing Enterprise Oversight (OFHEO) released its quarterly estimates of house price trends in the US last Thursday. I realize that this is a little late (circumstances have been consipiring against my blogging of late), but I'm hoping that this is indeed an instance of Better Late Than Never.

From the report's news release (pdf file):
U.S. home prices rose in the third quarter of this year, but the rate of increase continued to slow and some areas experienced actual price declines. Nationally, home prices were 7.73 percent higher in the third quarter of 2006 than they were one year earlier. Appreciation for the most recent quarter was 0.86 percent, or an annualized rate of 3.45 percent. This reflects a further slowdown from that reported for the second quarter when the quarterly appreciation rate was 1.3 percent and the annualized rate was 5.1 percent. The quarterly increase is the lowest since the second quarter of 1998.
Instead of focusing on the national average, however, I much prefer looking at the house price data city-by-city; real estate markets are quintessentially local, and the national average obscures most of the interesting bits of information about the US housing market.

The following picture shows the 12-month price change in houses in several coastal cities that enjoyed a significant house price boom during the period 2000-05.


The slowdown in the market for houses is striking in this picture. What is worrying about it to me, however, is that the downturn in house price appreciation has not yet shown any signs of leveling off. In other words, it looks very possible that one or more of these series will move into negative territory within the next couple of quarters, which would indicate y-o-y price declines. How negative, and for how long, is of course the big question. But until we start to see some leveling off in house price trends, I will remain nervous that the housing market slowdown still has quite some way to go.

On the other hand, many interior cities in the US either missed out on the big appreciation of 2000-05, or else jumped on the bandwagon late. The following picture shows some examples:


Putting these two pictures together, an interesting story emerges - one that is hidden by the national averages described above: house price appreciation continues at a moderate pace in many US cities, and is actually still very high in those places (such as the mountain West) that joined the house price boom a little late. But in those cities that enjoyed the biggest appreciations earlier in the decade, the slowdown in the housing market looks abrupt, increasingly severe, and far from over.

My concern is that it is precisely those rapidly cooling coastal regions of the US that contain most of the people who have been counting on rising house prices to sustain their level of consumption, as well to sustain the solvency of their balance sheets. Only when prices stop rising in those areas - or even start falling - will we really see the full impact of the slowing housing market on the rest of the economy.