Tuesday, October 31, 2006

Employee Compensation

The BLS released its quarterly estimate of labor compensation this morning. From the news release:
Total compensation costs for civilian workers increased 1.0 percent from June to September 2006, seasonally adjusted, virtually unchanged from the 0.9 percent gain from March to June, the Bureau of Labor Statistics of the U.S. Department of Labor reported today... The Employment Cost Index (ECI), a component of the National Compensation Survey, measures quarterly changes in compensation costs, which include wages, salaries, and employer costs for employee benefits for civilian workers (nonfarm private industry and state and local government).
The purpose of this survey is to look at how much more firms are paying their workers in wages and benefits. But naturally, the cost of labor to firms is the same thing as the compensation for labor earned by workers, so this data can be read in very different ways.

First, one might worry that it suggests inflationary pressures, as the cost of labor goes up.

But at the same time, this report signals that workers are earning more - which is good news for workers, after all.

Except for one problem: the figures cited above are all in nominal terms. Adjusting for inflation, the report provides yet more evidence of why most average Americans do not think that the economy is in great shape - the increases in compensation to workers are merely keeping up with inflation.

The chart below shows the series for wages/salaries and benefits for workers in the private sector. The wage/salary series was then deflated by the price index for personal consumption expenditures, and the benefits series was deflated by the price index for health insurance. (2006 figures were extrapolated from the first three quarters of the year.)


To be fair, benefits include things other than simply health insurance (namely employer retirement contributions), so this inflation-adjusted benefit series may overstate the degree to which inflation has eroded the value of those benefits. On the other hand, I'd be willing to bet that most of the nominal increase in the cost of providing benefits to workers is the result of rising health insurance premiums, not due to increasingly expensive retirement contributions... in which case the approximation presented above may not be too bad.

Regardless, this report certainly seems consistent the notion that average workers are not enjoying much of an increase in prosperity during this economic expansion.

The Incredible Shrinking Car Company!

Ford Motor Company is shrinking. From today's Wall Street Journal:
Ford Motor Co.'s plan to cut North American production as much as 12% in the first half of next year signals that Detroit's Big Three auto makers -- as well as their many suppliers -- could face headwinds in 2007 despite industry cost-cutting efforts.

Meanwhile, as a fresh sign of the ripples the auto makers could send across the manufacturing belt with further production cuts, Dura Automotive Systems Inc. became the latest auto-parts supplier to file for Chapter 11 bankruptcy-court protection. The separate developments highlight the continuing pain faced by General Motors Corp., Ford and DaimlerChrysler AG's Chrysler Group, amid signs of a slowing economy.

Ford's projected first-half 2007 cuts -- reported yesterday by trade publication Automotive News -- come on top of a 21% production cut planned for the current quarter.
The following picture, which I've reproduced from the Wall Street Journal piece, sums up the story.

Ford is now only 60% as large as they were a few years ago. And of course, they're not the only ones; GM and Daimler-Chrysler have been losing money for a while now, and just like Ford, they are also responding by obeying Alice's "DRINK ME" sign.

But note that the US auto industry as a whole has not been shrinking. Overall production of motor vehicles in the US continues to grow over time, despite fluctuations from quarter to quarter or year to year. The following picture shows total auto production in the US, measured in real terms, as reported by the Bureau of Economic Analysis (table 7.2.3b).


Even with the most recent quarter's possibly aberrant measurement of real auto production, the US as a whole has clearly been producing more cars over the past year or two than ever before.

So how do we reconcile these two pictures? Obviously, the answer is that auto production in the US is being gradually taken over by the big Japanese auto manufacturers, who seem to be able to make up for Ford and GM's production cuts, and then some.

That's why I tend not to see Ford and GM's problems as being signs of a sick industry in the US, but something much more prosaic: the replacement of poorly-run firms with well-run firms.

Sunday, October 29, 2006

The Previous 'Soft Landing'

Has the Fed managed to raise interest rates by exactly enough to bring the US economy down to a "soft landing"? There was substantial disagreement among economists about Friday's GDP report, with some arguing that it was a harbinger of a looming recession, while others argued that it was still consistent with the soft landing scenario, and didn't really contain anything to worry about.

We won't know which camp was closer to the truth for many months. But in the mean time, I can't help but be reminded of the discussions happening among economy-watchers in mid- to late-2000. The situation in 2000 was somewhat similar to today's economy in some ways; in particular, the Fed had been raising interest rates for some time in an attempt to cool the economy and bring down incipient inflation without pushing the economy into a recession, and many observers were of the opinion that they had succeeded. To help refresh your memory, here are some excerpts from the news at the time (sorry, I haven't tracked down links):
August 10, 2000
The Boston Globe
Economy Slowing for 'Soft Landing; Fed Reports Braking in Key Growth Areas: The hard-charging US economy slowed in the late spring and early summer, the Federal Reserve reported yesterday, suggesting a "soft landing" for the 10-year expansion indeed could replace the traditional boom-and-bust dynamic...


September 2, 2000
The Washington Post
Economic Growth Gradually Slowing; Reports May Reduce Chance of Rate Hike: More clearly than ever, three new economic reports out yesterday show the U.S. economy coming in smoothly for a soft landing. A series of increases in short-term interest rates by the Federal Reserve and other forces have combined to slow economic growth just enough to keep inflation largely at bay without significantly raising the risk of a recession.

The reports all pointed in that direction, according to a number of analysts, who also said the way events are unfolding suggests that Fed policymakers won't be raising rates again anytime soon.


September 18, 2000
The Wall Street Journal
Economic Data Continue to Augur Soft Landing:


October 28, 2000
Cleveland Plain Dealer
Economy Cools to Rate Suggesting Soft Landing: The economy shifted into a much lower gear during the summer, registering its slowest speed in more than a year and reflecting a drop in government spending and weaker business investment... "We have downshifted ... but we're not on the brink of a recession," said Paul Kasriel, chief economist for Northern Trust Co. The report, he said, is consistent with the Federal Reserve's desire to bring the high-flying economy down to a more sustainable rate of growth.


October 29, 2000
The Atlanta Journal and Constitution
Stock market fall hurts, but 'soft landing' helps


November 27, 2000
Business Week
This Political Shock Won't Upset the Soft Landing: THE FED SEEMS CONTENT that the slowdown is leading toward the desired soft landing, although policymakers are still not convinced that the threat of rising inflation is abating. After hiking its overnight rate from 4.75% in June, 1999, to 6.5% in May, 2000, the Fed at its Nov. 15 policy meeting continued to leave interest rates unchanged. The Fed admitted that the economy could slow to a pace even below its long-run trend, generally taken to be 3.5% or so. However, it said that the slowdown in demand to date has not been sufficient to alter its view that the risks in the outlook are weighted toward conditions that could generate higher inflation.

...The bottom line is that, yes, the economy is slowing as the Fed's efforts to pull off a soft landing bear fruit. And little indicates that this nation's ongoing political shock will rattle the economy, especially since the fundamentals remain quite sturdy. The Greenspan Fed pulled off a soft landing in 1994, and it will very likely succeed again in 2001 -- regardless of how long it takes to elect a President.


Dec 7th, 2000
The Economist
Slowing down, to what?: The latest economic figures are consistent with a soft landing. As Mr Greenspan made plain in his speech, an economic slowdown is what the Fed has been aiming to achieve by raising interest rates six times in the past 18 months. By creating economic slack, this should stop inflation rising further. And despite the share-price jump this week, recent market edginess will usefully remind investors about risk and so deter reckless investment.

The markets are also right that few economists are actually predicting a hard landing. The average forecast for growth in 2001 by 15 economists polled by The Economist this week was 3.0%.
For reference, we now know that the US economy experienced negative economic growth between July and September of 2000, and officially entered a recession in early 2001.

My point is a relatively simple one: I don't think that we have nearly enough evidence yet to conclude that the Fed has acheived a soft landing for the US economy. Any guesses about how rough the landing will be will thus have to be based on guesses, predictions, and assumptions about how consumers and businesses will behave over the next several months. So I would be hesitant to congratulate the Fed on its successful soft landing until we know (maybe by mid-2007) if the relatively optimistic suppositions about future consumer and business behavior were right.

It's also worth noting that even as late as November 2000, the signals from the Fed and the interpretation of Fed-watchers were that the chances were that the next interest rate move by the Fed would be an increase. Now we know, of course, that they were compelled to decrease interest rates just a few weeks later. So despite the Fed's rhetoric to the contrary, I would still be cautious in believing that the Fed's next move in the current episode will end up being another increase.

Friday, October 27, 2006

Third Quarter GDP, 2006

And the new numbers are in! What do they show? From today's BEA press release:
Real gross domestic product -- the output of goods and services produced by labor and property located in the United States -- increased at an annual rate of 1.6 percent in the third quarter of 2006, according to advance estimates released by the Bureau of Economic Analysis. In the second quarter, real GDP increased 2.6 percent.

...The deceleration in real GDP growth in the third quarter primarily reflected an acceleration in imports, a downturn in private inventory investment, a larger decrease in residential fixed investment, and decelerations in PCE for services and in state and local government spending that were partly offset by upturns in PCE for durable goods, in equipment and software, and in federal government spending.
That hurts, a little. This estimate comes in below expectations of a number more like 2.0%. I'll take a closer look at the data later today, but the one thing that really stands out right away is the big slowdown in residential investment. It looks like this is the housing market slowdown in action...

Thursday, October 26, 2006

More Class Warfare

Andrew Samwick shares some thoughts about the issue of Rich v. Super-rich. He argues that what the Rich resent is that their occupations are not rewarded as they think they should be, under some sort of socialist economic system:
I think the educated trade classes resent that the contributions they make through their intellect and efforts are not valued by the market as highly as the returns to innovation and risk taking in product markets. The amenities that would accrue to them under (their idealized notion) of a more socialist system are becoming more expensive.
I have to disagree with Andrew. And I think I can pinpoint the source of our disagreement: I don't think that the division betwen the Rich and the Super-rich is occupation-based. In other words, I'm skeptical that it's as simple as Andrew describes, wherein well-educated professionals (doctors, lawyers, etc.) are merely Rich, while the Super-rich are entrepreneurs and financiers.

My hunch is, instead, that there are both Rich and Super-rich people from each of these various occupations. Some doctors, lawyers, as well as entrepreneurs, entertainers, and athletes become Super-rich, but most of each group do not. And that's where the trouble starts. Those who are merely Rich look at their peers who have become Super-rich, and feel cheated. And resentful. They gripe and complain. They gnash their teeth. And then they vote to soak the Super-rich.

If the divisions between the two groups are indeed not occupation-based, then the success of the Super-rich could seem much more arbitrary to people, and thus be a much greater potential source of bitterness. After all, if it's simply a question of choosing a different occupation to become Super-rich, then you have only yourself to blame. But if you see others with your exact occupation becoming Super-rich, then that's different.

Shorter Kash: I think being lucky has a lot more to do with becoming Super-rich than being in the right occupation.

Is the Worst Really Behind Us?

I don't know, something about these types of quotes (in reference to yesterday's data showing that the slowdown in the housing market is continuing) worries me:
WASHINGTON, October 25, 2006 - Existing-home sales eased last month, as did the number of homes available for sale – indicating the housing market is stabilizing, according to the National Association of Realtors®.

...David Lereah, NAR’s chief economist, said stabilizing sales should build confidence in the housing market. “Considering that existing-home sales are based on closed transactions, this is a lagging indicator and the worst is behind us as far as a market correction – this is likely the trough for sales."
A little patience, please. The housing market slowdown has been happening for 6 months or so. Isn't it a little soon to conclude that the worst is over?

As a comparison, suppose that you had concluded that the worst was over one year into the last major national housing market slump, in 1990. By the end of 1990 you would have seen the trajectory of house prices looking something like this:


Patience, I urge. Because if you had indeed supposed that the worst was over at the end of 1990, merely one year into that housing slump, you would have been quite mistaken. For the housing market works slowly, and its cycles are very long. The worst was not over by the end of 1990. Not even close.


It will be years, not months, before we will be able to say that "the worst is behind us" regarding the housing market.


UPDATE: If I had waited a few more minutes on this post, I could have built this morning's news into it:
Builders slash prices to sell more homes
Sales up 5.3% in September, but prices plunging at fastest rate in 36 years


WASHINGTON (MarketWatch) -- U.S. homebuilders slashed prices at the fastest pace in 36 years in September and managed to boost sales to the highest level in three months, the government said Thursday.

The government reported that sales of new homes unexpectedly rose 5.3% in September to a seasonally adjusted annual rate of 1.075 million, the most in three months and well above the 1.05 million expected by economists surveyed by MarketWatch. However, sales in June, July and August were revised down by total of 67,000 annualized, continuing a pattern of downward revisions to the originally reported data.

...Median sales prices dropped 9.7% in the past year to $217,100, the lowest price in two years. It's the largest percentage decline in median prices since December 1970. Median prices for existing single-family homes are down 2.5% in the past year, the largest decline ever recorded.
Indeed.

A Brief History of Pauses by the Fed

With the Fed's action yesterday, the Fed funds rate will remain at its current 5.25% at least until December (barring something really dramatic and unforseen) - which means that the pause in changes in the Federal Funds rate will be at least 163 days long.

For comparison, there have only been three previous instances in the past 25 years when interest rates were held steady for at least 100 days following an interest rate hike:
  • 1989: rate hike, then a 101-day pause(with the exception of a tiny 19-day blip in rates at the end of that period), then rate cut;
  • 1995: rate hike, then a 154-day pause, then rate cut;
  • 2000: rate hike, then a 231-day pause, then rate cut;
  • 2006: rate hike, then at least a 163-day pause, then... ?.
And that is all.

The Fed's statement yesterday seemed relatively bullish, in the sense that it warned that the Fed might need to raise rates in the future, but said nothing about the possibility of needing to cut rates in the future. However, history certainly seems to be on the side of those who suspect the next move (when it comes) will be a rate cut, not another rate increase.

Wednesday, October 25, 2006

The Value of Oversight

Democrats around the country are campaigning largely on the idea that they will provide much-needed oversight over the executive branch. It's not a sexy topic to run a campaign on, and some have interpreted it as a thinly disguised call for Democrats to dig up dirt on the Bush administration and be obstructionists for the next two years.

But perhaps "oversight" could mean a little more than that. Menzie Chinn does a nice job highlighting a speech that GAO Comptroller David Walker gave last month. The table he highlights shows that the US government's future liabilities more than doubled between 2000 and 2005 - an increase of $26 trillion. Menzie writes:
When the President speaks of the Administration's commitment to fiscal restraint, and the need to rein in Social Security, it behooves us all to look at the fourth line under "implicit exposures"; the largest single increment to the the present value of liabilities -- larger than explicit liabilities (U.S. Treasury debt) run up with all the budget deficits over the past 5 years, and larger than Social Security liabilities that have troubled the Administration -- is Medicare Part D, passed by this Congress, and signed into law by President Bush.

Wasn't there any oversight at the time? And didn't somebody know about the immense fiscal burden imposed by the passage of this legislation. The answers are respectively "no" and "yes".
So what's the value of proper governmental oversight? Apparently, several trillion dollars.

Tax Reform versus Tax Cuts

David Altig today provides a nice summary of some recent discussions of the Laffer curve, prompted by the recent claims by some that the federal budget deficit is falling thanks to the Bush tax cuts. He also gives a qualified defense of, if not the actual Laffer curve, then at least some "Laffer-type effects". The example he points to is this:
Several years back, I was part of a team that simulated the effects of the HR flat tax, and similar forms of fundamental tax reform. We found that in the most straightforward version of this type of tax reform, the shift from something like our present income-based tax system to an HR-like consumption-based system would require a tax rate on labor-income of 21.4 percent in order to keep revenues from falling. Over time, as the growth effects of removing capital taxation took hold in our experiments, the tax rate required to maintain revenue neutrality fell by 2 percentage points.
The study he cites is a fascinating one, which I had forgotten about (so thanks for the reminder, David!). But I would disagree considerably with David about how to characterize the simulation result that he mentions, however.

I think that the results he alludes to are not at all of the Laffer variety. The idea of the Laffer curve is that cuts in tax rates lead to increased tax revenues. Yet what David is describing is something quite different, it seems to me: revenue-neutral tax reform. In other words, rather than the simulations showing that tax cuts cause tax revenues to go up, they show that certain types of tax reform (e.g. shifting taxes away from capital and onto consumption or labor) may cause revenues to go up.

I don't think that most economists would disagree with the notion that tax reform, if done properly, could be greatly efficiency-enhancing (though I'm not personally convinced that capital formation is that sensitive to the rate of taxation of capital). And as a result, most economists would agree that if one changed the ways taxes are collected, one might be able to collect the same amount of tax revenue at lower marginal rates. And that seems to be what the Altig, et al. study illustrated. But that seems to be something quite different from Art Laffer's notion that simply cutting the marginal rates of the taxes we have today will lead revenue to rise.

Class Warfare: Rich v. Super-rich

Matt Miller tells a story in this week's Fortune Magazine that is almost a parody. Almost, but not quite. Because he may actually be on to something...
(Fortune Magazine) -- Not long ago an investment banker worth millions told me that he wasn't in his line of work for the money. "If I was doing this for the money," he said, with no trace of irony, "I'd be at a hedge fund." What to say? Only on a small plot of real estate in lower Manhattan at the dawn of the 21st century could such a statement be remotely fathomable. That it is suggests how debauched our ruling class has become.

The widening chasm between rich and poor may well threaten our democracy. Yet if that banker's lament staggers your brain as it did mine, you're on your way to seeing why America's income gap is arguably less likely to spark a retro fight between proletarians and capitalists than a war between what I call the "lower upper class" and the ultrarich.

Here's my outlandish theory: that economic resentment at the bottom of the top 1 percent of America's income distribution is the new wild card in public life. Ordinary workers won't rise up against ultras because they take it as given that "the rich get richer."

But the hopes and dreams of today's educated class are based on the idea that market capitalism is a meritocracy. The unreachable success of the superrich shreds those dreams.

"I've seen it in my research," says pollster Doug Schoen, who counsels Michael Bloomberg and Hillary Clinton, among others. "If you look at the lower part of the upper class or the upper part of the upper middle class, there's a great deal of frustration. These are people who assumed that their hard work and conventional 'success' would leave them with no worries. It's the type of rumbling that could lead to political volatility."
I actually know quite a few "lower uppers", and I have to agree - some of them are really bitter and angry at the way income is flowing to the upper-uppers. They're as smart (or smarter), they've worked just as hard, but they just haven't gotten that one lucky break that separates the rich from the super-rich. Who knows what such resentment could cause?

Changing the Minimum Wage: More Evidence

A few days ago, I argued that raising the minimum wage would have a negligible impact on employment. I showed you a few simple tables to illustrate my point, but now let me talk about the real, peer-reviewed econometric evidence that I was referring to. (Too bad we can't just rely on the simple, easy-to-understand evidence...)

To reiterate: my goal in this series of posts is to show you that the most frequent criticism of the minimum wage – that it costs low-income people jobs – has surprisingly little evidence to back it up. Luckily for me, that is a much more modest task than trying to prove that minimum wage is a good way to help low-income workers, or that it is the best way to help them. (Maybe if I'm feeling brave I will try to get to address those questions later.) But to start with, it is helpful to know whether the most common criticism of the minimum wage is borne out by the data.

So with that in mind, let’s take a look at some different types of statistical evidence about the effects of the minimum wage on employment levels.

The article that really started what’s now called “the new minimum wage research" (the research of the past 15 years or so that has called into question the classical prediction that raising the minimum wage will reduce employment) was the famous paper by David Card and Alan Krueger, “Minimum Wages and Employment: A Case Study of the Fast-Food Industry in New Jersey and Pennsylvania”. From the paper’s abstract:
On April 1, 1992, New Jersey's minimum wage rose from $4.25 to $5.05 per hour. To evaluate the impact of the law, the authors surveyed 410 fast-food restaurants in New Jersey and eastern Pennsylvania before and after the rise. Comparisons of employment growth at stores in New Jersey and Pennsylvania (where the minimum wage was constant) provide simple estimates of the effect of the higher minimum wage. The authors also compare employment changes at stores in New Jersey that were initially paying high wages (above $5.00) to the changes at lower-wage stores. They find no indication that the rise in the minimum wage reduced employment.
Since that paper was published in 1994, there has been a host of new research trying to confirm or contradict Card and Krueger’s startling result that the rise in minimum wages, if anything, led to increased employment in the quintessential minimum wage industry, the fast food industry. (That's what econonomists do, after all - try to destroy each others' results. But at least it's all in good fun. Mostly.)

Lots of different strategies have been employed, from studies that look at national employment trends and how they respond to changes in the federal minimum wage, to other studies that look at state-wide or city-wide minimum wage laws. Several papers have found that raising the minimum wage actually had positive effects on employment, while a few (particularly those that focus only on teenage employment, such as this paper by Burkhauser, Couch, and Wittenburg) found that it had negative but generally small effects on employment.

To my knowledge, the most recent example of a rigorous paper trying to empirically estimate the effects of minimum wage on employment is “The Economic Impacts of a Citywide Minimum Wage” by Arindrajit Dube, Suresh Naidu, and Michael Reich, put out as a working paper just a couple of months ago. From the abstract:
We provide here the first study of the economic impacts of a citywide minimum wage – San Francisco’s adoption of a minimum wage of $8.50 in early 2004. The policy increased pay, compressed wages among restaurant workers and did not create any detectable employment loss among a ected restaurants. Our point estimates on employment are positive... and we reject some of the negative employment elasticity estimates of previous studies.
They use a lot of sophisticated econometric techniques to arrive at their result, but really the story can be summed up by just one chart from their paper, which shows how employment in the restaurant industry changed in San Francisco and in neighboring Alameda county after SF imposed its high minimum wage.


The picture doesn't really need a lot of sophisticated statistical interpretation to understand. The minimum wage goes up in one place, but doesn't change right next door. Employment in restaurants goes up in both places - if anything, by more in the place where the minimum wage went up. (Again, it's too bad that economists aren't convinced by a simple picture... but if you want all the gory statistical details where they control for other possible forces affecting restaurant employment, go ahead and take a look at the paper.)

Putting all of these different types of papers together, my conclusion is that the best evidence that labor economists can gather from US data seems to indicate that we need not fear major employment losses if we were to increase the minimum wage. The effects may be slightly negative for teenagers, but overall the effect on jobs may be zero to even slightly positive.

In my next installment in this series, I’ll take a look at the international evidence, and also try to explain why it could be that the minimum wage causes employment to actually rise, not fall.

Tuesday, October 24, 2006

Which Way Are Profits Going?

It's earnings season on Wall Street, and Barry Ritholtz draws our attention to the way in which corporations are continuing to announce yet another quarter of double-digit profit growth. Barry writes:
My reservations about earnings have been twofold: First, SPX gains have been unusually reliant on energy and materials stocks, accounting for a disproportionate (by some measures, as much as half) of earnings improvements; Given the drop in oil, copper, steel, etc., (at least short term), these companie's contribution to S&P profitability are likely to feel some impact.

Secondly, financial engineering of year-over-year earnings continues via share buybacks. About a third -- 5 of the 15% E gains -- are due to the massive stock buybacks we have seen. According to Merrill Lynches David Rosenberg, this has reduced share count to the point of improving earnings by that third.
He also points us to this NYTimes article:
Comparisons That Make Earnings Look Good

AT first glance, the quarterly earnings season is off to a healthy start, but one analyst warns that there may be less to the recorded growth than meets the eye...
On Friday, the BEA will release the first estimate of GDP for the third quarter of 2006. While interesting in its own right, the data release will also include a first estimate of corporate profits.

During the last peak and subsequent downturn in corporate profits in the late 1990s, companies resorted to a variety of techniques (some legal, and some decidedly not) to be able to continue issuing favorable earnings reports. By 1999 and 2000, when corporations continued reporting strong profit growth from earlier periods, it became clear that something strange was going on, because profits as measured by official government statistics showed that profits had fallen since 1997. The following chart shows the path of corporate profits over the past 20 years.


My question now is this: is this same thing starting to happen all over again? Have corporate profits truly peaked (as they did in 1997), and are companies resorting to creative ways of stating their earnings to disguise that fact? While profits were slightly lower in the second quarter of 2006, having another quarter of data will do a lot to help us get a handle on this possibility. We'll find out on Friday.

To Be Nice, or Not to Be Nice?

That is the question. Mark Thoma draws our attention to the very different answers that Paul Krugman and Robert Reich provide this week. From Krugman:
As long as polarization is integral to the G.O.P.’s strategy, Democrats can’t do much, if anything, to narrow the partisan divide. Even if they try to act in a bipartisan fashion, their opponents will find a way to divide the nation — which is what happened to the great surge of national unity after 9/11. One thing we might learn from investigations is the extent to which the Iraq war itself was motivated by the desire to have another wedge issue.

...The truth is that we won’t get a return to bipartisanship until or unless the G.O.P. decides that polarization doesn’t work as a political strategy.
And from Reich:
Anyone who say Dems can [both focus on exposing the malfeasance of the Bush Administration... and focus on how to turn the country around] is living on another planet. A fundamental strategic choice lies ahead: Either expose Bush or build the new agenda. Either will require a huge effort to marshal facts and focus public attention. Either will necessitate extensive public hearings and a concerted media strategy. Either will be competing with a cacophony of campaign personalities, more bad news from Iraq, and a likely slowing of the economy.

If both are tried simultaneously, the media will focus on the more sensational – which will be dirt on the Bushies. Kiss the new agenda goodbye.
Myself, I tend to think that there's virtually no chance of Democratic policy initiatives actually being made law while Bush is president. Therefore, the goal of the goal of the Democratic Congress must be to help build toward a stronger Democratic mandate in future years, when Democrats may actually be able to make policy.

So then it becomes a question of tactics. Which tactic will help elect more Democrats in the future: exposing the terrible side-effects of the viciously partisan GOP leadership of the past several years, or defining and promoting Democratic ideals, principles, and agendas? I'm not convinced that the two are mutually exclusive, in which case the answer is clear...

What a Head in the Sand Looks Like

Is it stubbornness, or ignorance? It so often seems hard to tell with this White House. Yesterday Bush said that one of his highest priorities in his final two years in office is to address the looming Social Security and Medicare funding problems. Good. I'm glad. I agree that those are the most important fiscal issues that our generation will face, and rightly deserve high priority in the next year.

However, I was dismayed to then read that his prescription for doing so was to index Social Security benefits to inflation rather than wages. From Reuters:
President George W. Bush on Monday put Social Security reform on his list of "big items" to deal with in the final two years of his presidency, possibly including indexing benefits for wealthier Americans. Interviewed on CNBC television, Bush said: "I want to deal with the unfunded liabilities inherent in Social Security and Medicare."

...Bush said "my idea" is that Americans at lower income levels would see benefit payments continue on the current basis, but "if you're a wealthier citizen, your benefits increase at the cost of living...so everybody's benefits go up but some go up faster than others."
Haven't we already been through all of this? Reducing benefits (which is what such indexing would do) is a perfectly reasonable possibility to address the Social Security shortfall (though not one that I happen to agree with)... but it is a fix to the SS problem that was clearly and soundly rejected by the country when Bush did everything he could to sell it - for 6 full months - in 2005.

And much more importantly, I was surprised that he made no mention of any effort to address the fiscal problem that makes the Social Security gap look tiny by comparison: the impending fiscal crisis that will be brought on by federal health spending in coming decades.

Just as a refresher, here's the picture from the most recent Social Security and Medicare Board of Trustees Report:


The small pink bits at the bottom of each bar represent the SS funding gap. The rest of the bar is the funding gap that the government faces to pay for health benefits that have currently been promised to Americans.

If you really want to tackle the real problem, then you must - must - address the health care funding crisis. I hope to be pleasantly surprised, and find that Bush takes his head out of the sand about that problem at some point during the remainder of his presidency. But I'm not holding my breath.

Monday, October 23, 2006

How Long a Pause for the Federal Funds Rate?

This week the Fed mulls over whether or not to change interest rates. Market participants seem to agree think there's virtually no chance of interest rates being changed, and most economists would concur.

In fact, it seems quite likely that interest rates will remain where they are for a little longer. But perhaps not for too much longer.

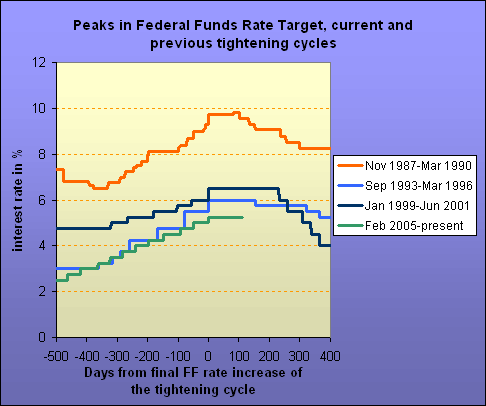
If we look at the three previous episodes when the Fed raised interest rates consistently for a period of time (i.e. tightening cycles), we find that in two of the past three instances the peak interest rate was maintained for only a few months before the Fed reversed course and began cutting interest rates again.


In the third instance (in 2000) the peak was maintained for a bit longer... but as I've argued before, even that seven month pause is short enough that I worry that it illustrates that the Fed has a tendency to overshoot when it raises interest rates.

Of course, it could turn out that after the present pause in interest rate changes, the Fed will see renewed strength in the economy, and decide to resume raising interest rates (similarly to what happened in 1988, with a three-month pause in the rate-tightening cycle). But I don't think so. Right now almost all signs are pointing to moderating growth, not accellerating growth (see David Altig and Jim Hamilton for some other perspectives on this, however). To me, it seems unlikely that that will change anytime soon, because I can't really see what sector of the economy has enough 'umph' left in it to drive a strongly renewed expansion.

That's why my bet is that, in another two or three months, we'll be ready to start looking for interest rate cuts from the Fed.

Good News for Democrats

Apparently the White House continues to stubbornly believe that claiming credit for the state of the US economy is actually going to help them in the coming election. From the AP:
WASHINGTON - With his party facing a difficult midterm election,
President Bush is focusing on the positive this week: a growing economy he is using to try to persuade voters to keep Republicans in power in Congress. [sic]

...Overall, the economy grew at a 2.6 percent pace from April through June, compared with a 5.6 percent pace over the first three months of the year, which was the strongest spurt in 2 1/2 years. Still, voters remain uneasy even though gasoline prices have started dropping, the stock market is hitting record highs, and interest rates on credit cards and adjustable mortgages are leveling off.

...White House political director Sara Taylor said that the economy is a key issue in about two dozen House races... "It's going to have an important impact on certain races around the country," Taylor said. "I think it's an important issue that's not getting a ton of attention."
If the White House suceeds in directing more attention to this issue, then the Democrats are in good shape. Stories like this make me believe that perhaps the Democrats really are going to have a successful election, after all...

Saturday, October 21, 2006

How Should Libertarians Vote?

This week's Economist has an article about libertarians, or as they call it "the neglected swing block":
What's a true freedom-lover to do on polling day?

AMERICA may be the land of the free, but Americans who favour both economic and social freedom have no political home. The Republican Party espouses economic freedom—ie, low taxes and minimal regulation—but is less keen on sexual liberation. The Democratic Party champions the right of homosexuals to do their thing without government interference, but not businesspeople. Libertarian voters have an unhappy choice. Assuming they opt for one of the two main parties, they can vote to kick the state out of the bedroom, or the boardroom, but not both.
Of course, I would disagree with The Economist's assessment of the Democratic Party. The primary way in which most Democrats want to interfere with businesspeople is simply by taxing the very richest of them by a little bit more today - which translates into effectively cutting taxes on them in the future (by reducing the government's debt). But enacting generally increased regulation of business is not high on the agendas of most Democrats.

But this piece reminded me of the interesting debate that has gone on at the Cato Institute (the intellectual home of American libertarians) regarding this question: should libertarians vote Democrat? If you're curious for the details of all of the salient arguments, check out the initial essay by Markos Moulitsas as well as all of the subsequent reaction by numerous thoughtful, well-spoken people.

However, if you don't need all of the details and instead will just be happy with the punchline, then I present to you the list of reasons for libertarians to vote democratic, as originally complied in a classic post by Angry Bear almost three years ago (and very slightly added to by me):
Here's my offer to Libertarians: you've tried the Republicans and that clearly isn't working out, so give the other side a try (and bring your Libertarian friends with you). Here's what you'll get in exchange:
  1. We'll let you sleep with whomever you want to.
  2. We won't force you to pray or otherwise interfere with your private religion.
  3. We won't force you to pay for other people's religious choices.
  4. We still won't let you smoke pot on the public square, but Democrats generally support decriminalization. And we'll do all we can to promote rehabilitation over incarceration.
  5. We won't start unilateral wars without evidence of a real threat.
  6. We won't spend as much of your money as Republicans, though still more than you would like.
  7. For most Libertarians, those making roughly $100k or less, we'll tax you either no more, or less than the Republicans will.
  8. We will generally support free trade at least as often as Republicans.
  9. We will run a smaller government than Republicans.
  10. We will regulate business no more than Republicans, other than by doing more to fight monopoly power and ensure vibrant competition. In fact, we may interefere less with business by no longer playing favorites with some industries over others.
  11. We won't interfere with your reproductive rights and choices.
  12. Despite what you might think, we really won't take your guns away (possible exception: if you are a criminal).
It seems like a pretty good case to me.

Friday, October 20, 2006

Changing the Minimum Wage: Some Evidence

One of the first things that a Democratically-controlled Congress can be expected to do is to pass an increase in the minimum wage. Some people warn that such a move would cost many people their jobs (see today’s op-ed piece by Diana Furchtogott-Roth as an example), the logic being that firms would do better to lay off those workers that they currently pay $5.50 or $6.00 per hour, rather than increase their pay to $7.25. Yet there must also be some reason that over 650 economists signed a letter last week calling for a rise in the minimum wage.

In a couple of posts over the next week, I want to try to present the specific evidence on both sides of this debate. But let me start by letting you know my opinion right up front.

When I started my graduate studies in economics, I was perfectly accepting of the classical economic analysis that illustrates why a minimum wage should cause low-income people to lose jobs. But by the time that I had finished grad school, I had learned that there are economic theories that lead to different conclusions, and I felt that I had seen enough evidence to call into question the classical prediction of the effects of raising the minimum wage. Since then, the additional evidence that I’ve seen has tended to generally confirm that minimum wage laws only have a very small negative impact (or very possibly no impact at all) on employment.

This is a subject on which I have tried to let the empirical evidence guide my opinion. And personally, I'm persuaded that the benefits of a higher minimum wage for low-income individuals (and the distribution of income more generally) outweigh any possible negative employment effects.

As a cursory preview to the kinds of evidence that I’m talking about, let me share with you a quick analysis I did last night on the northeastern states of the US. Most – but not all – states in the northeast have minimum wages that are above the federal level of $5.15/hr. And most of those states have raised their minimum wages at some point in the past several years. This provides a type of natural experiment, where we can compare what happens to employment and wages in neighboring states (and thus states that are hopefully quite similar, and subject to similar economic forces) when some of them raise the minimum wage, and others don’t.

The first table shows the minimum wages across the northeastern states between 2000 and 2005. The states are ranked by the level of their minimum wage in 2005.


As you can see, there's quite a range, from Connecticut, which raised its minimum wage all the way up to $7.10, to New Hampshire, New Jersey, and Pennsylvania, which have kept their minimum wages at the federal level of $5.15.

Now take a look at how employment and wages have changed across those states. The following picture shows private sector employment and average weekly wages for each state. The states are ranked from left to right in order of how much they raised their minimum wage over the period 2001-05. Maine tops the list, having raised their minimum wage by $1.20 over the period; in the middle come states like Massachussets and New York, who raised their minimum wages by $0.75 and $0.85 respectively; and rounding out the group (at the right of the graph) are the three states in the Northeast that have adhered to the federal minimum wage.


Sources: State employment levels comes from the Current Employment Statistics; data on wages by state comes from the Quarterly Census on Earnings and Wages.

If you see a systematic relationship in this chart between raising the minimum wage and employment or wages, then you have better eyes than I do. (Note: their formal statistical correlations are almost exactly 0.0 in both cases.)

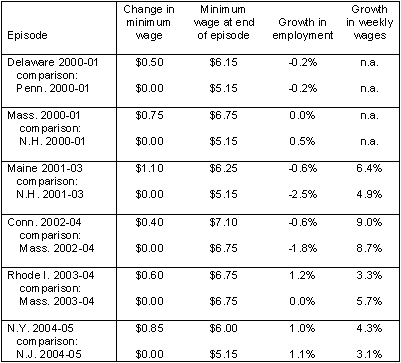
One last thing we can do is look at specific episodes of increases in the minimum wage. In the following table I’ve selected all of the instances where one of the Northeastern states increased its minimum wage, but where a similar neighboring state did not. The table shows what happened to overall employment in the private sector and to the average weekly wage in the private sector each case.


In one of these six cases (Massachussets) private-sector employment grew a tiny bit more slowly than in its neighbor; in two of these cases private-sector employment grew by roughly the same as in a neighboring state that didn’t raise the minimum wage; and in three of these cases the state raising its minimum wage actually enjoyed faster employment growth than a neighboring state.

This is not definitive proof, of course. But what this data does suggest is that any effect of raising the minimum wage on employment levels is almost certainly tiny, and generally swamped by other factors in the economy that influence employment much more strongly. The burden of proof is on those who think that higher minimum wages do indeed cause employment to fall, and as hinted at by the charts and tables presented here, it’s surprisingly tough to come by such evidence.

Thursday, October 19, 2006

Economic Cheerleading, Economic Misleading

The economic cheerleading continues, this time from George Will:
Every election year -- meaning every other year -- brings an epidemic of dubious economic analysis, as members of the party out of power discern lead linings on silver clouds.
GDP growth has been strong, Will writes. The federal budget deficit is low. Oil prices are down in recent months. And weak measures of labor compensation (such as those that I showed you the other day) are simply due to measurement problems, according to Will.

It's one of those pieces that makes me lose heart a bit. Every single one of the points that Will makes is misleading, disingenuous, beside the point, or all three. Just where should I begin in explaining how wrong Will is?

Do I start by mentioning that the federal budget deficit, while relatively low this year - so long as one includes the larger-than-expected Social Security surplus - is actually (thanks to the Bush tax cuts) still worryingly high when properly accounted for, and is set to go far higher in coming years?

Do I start by noting that he's comparing oil prices today with the very worst of the oil shock in 1980 (a period of time that we definitely don't want to come even close to resembling), that oil prices have only been relatively low for only a couple of months, and that could just as easily go all the way back up in another month or two?

Should I begin by explaining that the point Will raises about individuals constantly shifting their consumption patterns away from more expensive items and toward cheaper things is an obvious phenomenon that economic statistics already account for?

Or should I begin by noting that the tax cuts, which Will argues have put much more money into the pockets of average people but which went overwhelmingly to the wealthiest Americans, actually had only a tiny impact on average Americans - only on the order of a couple of hundred dollars per taxpayer per year?

No. Instead, let me just make one far more simple point. If the economy is so good, why do so many middle-class American's think that it's so mediocre?

Looking Peaky?

There were a couple of data releases this week that may have suggested (in that whispering-in-your-ear kind of way that only economic data can) the first hard evidence that we've passed the peak in this business cycle.

First, take a look at yesterday's new data on consumer prices. The overall rate of inflation on consumer goods has dropped sharply over the past couple of months, and even the rate of inflation on core goods (i.e. excluding energy and food items, whose prices are, as we know, far more volatile than most other items) seems to have stopped rising. The picture below illustrates.


If inflation (particularly core inflation) has indeed peaked and started dropping, then that might be a signal that the US economy has slowed its growth, causing inflationary pressures to diminish.

Meanwhile, the Federal Reserve Board released its estimates of production by US industry. The industrial production and capacity utilization measures for US manufacturing also seem to have topped out in recent months, as shown below.


Now of course, for both inflation and industrial production, it is entirely possible that those series will resume their upward climbs next month. But the fact that both of these series seem to be pausing at the same time does suggest that there may be a common explanation for both: a measurable slowdown in the US economy.

So it may well turn out to be the case that we will be able to say that the current economic expansion started losing steam in the middle of 2006. Time will tell.

What is OPEC Thinking?

It wasn't very long ago that OPEC used to have a price target for oil of about $25/bbl. Today it seems like OPEC's target for the price of oil is closer to $60/bbl. From CNN/Money:
OPEC's big gamble

NEW YORK (CNNMoney.com) -- If OPEC follows through on the talk that it will cut oil production by a million barrels a day, it will send a clear signal that the cartel feels the world can handle $60 oil.

...Analysts had long predicted OPEC would cut production if crude oil sank into the $50s, especially since autumn is typically a season of low demand. The decline has come as economic growth has slowed and supplies swelled to levels above or well above average for this time of year.

Analysts said the biggest reason OPEC, which currently supplies better than a third of the world's 84 million-barrel-a-day habit, will likely cut production is because it can. The global economy has continued to grow despite oil's record run. And demand, while slowing, continues to rise.

"They are all enjoying the largesse" of higher prices, said John Kilduff, an energy analyst at Fimat in New York. "And they see the global economy can handle it so far."
But actually, I think the dynamics of oil prices are much more complicated than this. Suppose that you believe that the price of oil right now includes a "risk premium". Traders are willing to pay a little more for their oil right now because they worry that in the future something bad could happen in the oil markets (a terrorist attack, civil disturbances in a major oil-producing country, etc.) which could drive oil prices up sharply. Thus today's oil prices are higher than they would be, because of this risk.

If that's the case, then OPEC putting aside some productive capacity could actually be a move on their part to try to reduce that risk premium, in an effort to keep oil prices low enough that people don't substantially change their oil consumption behavior. The CNN/Money piece mentions this possibility as well:
"Potentially, [having some reserve capacity] will take away some of the fears," said Kilduff. "This is taking a significant production cushion and putting it just offstage."

Not everyone agrees with that view.

While OPEC will no longer be pumping at full capacity, there is still little room between what the world consumes and what it is able to produce.

"We still have that fundamental issue," said Brian Hicks, co-manager of the Global Resources Fund at U.S. Global Investors. "If we had a supply disruption it would really tighten up the markets in a hurry."
Where I disagree with the CNN/Money piece is whether this means that the production cut may "come back to haunt" OPEC. I tend to think that OPEC has a lot of smart people working for it, and so I am pretty easily persuaded that OPEC's goal is not to drive prices higher, but rather to keep them low enough to discourage conservation efforts. After all, consumers in the US now seem perfectly happy to pay only $2.25 for a gallon of oil...

Wednesday, October 18, 2006

Credit Where Credit is Due

Many Republicans have been wondering recently why Bush and the GOP have not gotten credit for the strong national economy. With Bush's approval ratings lower than any post-war president (other than Nixon), and Republican congressional candidates across the country in danger of losing the upcoming election, it's a fair question.

Some argue that it's simply a problem of perceptions. Yesterday, George H.W. Bush (#41) complained that even though the economy is very good, for some reason the Republican White House has been unable to convince people of that fact. As reported by the Dallas Morning News:
Former President George Bush said Tuesday that although he believes the U.S. economy is strong, he's worried that the average citizen might not be getting that message.

Speaking at a restaurant industry conference in Dallas, Mr. Bush pointed to third-quarter earnings gains, robust growth in the gross domestic product and "unemployment that has fallen to good levels."

"The unmistakable picture that those statistics mean to me is that the economy is strong," the 41st president told attendees of the Multi-Unit Foodservice Operators conference, who gave him a standing ovation when he entered the room.

"There is a concerted effort to make it appear that the economy is bad," said Mr. Bush, the father of President George W. Bush.
It's true, one possible explanation for the fact that many Americans don't think the economy is doing very well is that there is some sort of conspiracy to hide the truth from the American people. This conspiracy presumably somehow overwhelms the fact that the American people do actually live in the US economy, and thus probably have some independent information about the condition of the US economy.

However, an alternative (and in my mind, far more plausible) explanation is simply that the US economy has not, in fact, been that great from the point of view of average Americans. It turns out that there's a fair amount of economic data to support this latter possibility.

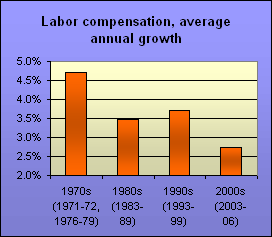
Take a look at the following pictures. I tried to think of those macro data series that most closely reflect the average person's experience: the amount of work available (measured as the total hours of labor demanded by firms), the average hourly earnings of workers in the private sector, the amount of overall compensation that individuals receive for their work (thus excluding capital income), and the actual salaries and wages that people earn. All data is expressed in real (inflation-adjusted) terms, and in each decade recession years are excluded.


It's quite striking that by each of these measures, the US economy performed quite poorly since 2003. The current economic expansion has simply not delivered the employment or wage growth that people expect from the US economy.

So why hasn't Bush gotten credit for the state of the US economy? Actually, I think that he has. And from the GOP's point of view, that's exactly the problem.


UPDATE: PGL has much more on this subject at Angry Bear, including a good dissection of some typical Republican talking points on the economy, as presented by James Sherk of the Heritage Foundation. In addition to playing some cute games with starting and ending points in their data analysis (see Sherk's piece and PGL's rebuttal for examples), those who argue that the economy is really a lot better than the average American thinks still need to answer the important question that I tried to highlight above: why do so many people perceive the economy as being so mediocre, if it's really so great?

Tuesday, October 17, 2006

A Demographic Milestone, of Sorts

The festivities surrounding 300 Million Day have gotten me to thinking about population growth in the US. How did we get here? Where will we go next? Okay, well maybe that last question wasn't such a good one, since 301 million seems like a pretty sure bet, but it is interesting to think about how we reached this point.

The picture below shows population growth in the US since the Civil War. Note that the "percent due to immigration" is calculated as the total immigration flow into the US during the decade (legal plus the US government's estimate of illegal immigration) divided by the total population growth during the decade.


Note: For easier comparability with other decades, the population growth rate from 2000-06 is extrapolated to show the decade-long growth rate.
Sources: Population estimates are taken from Census. Immigration estimates come from the Office of Immigration Statistics.


It's an interesting picture. Population growth in the US has been relatively low in recent decades - about 1% per year - but since the 1980s a fairly large share of that growth has been due to immigration flows.

As a result, the US population is now over 300 million. Are you feeling a bit crowded? If so, let me offer these little tidbits of perspective. While the US does have a lot of people in absolute terms - only China and India have more people - the US's share of the world population has gradually fallen since the middle of the 20th century.


Or think of it another way: a single province in India (Uttar Pradesh) has nearly two-thirds the population of the entire United States, with over 180 million people - all in an area about the size of Oregon.

So, if you live in the US, enjoy your elbow room.

Exchange Rates That Follow, Not Lead

Lots of electronic ink has been spilled over the past few years abcut the monstrous US current account deficit, and the correction which is completely certain but at the same time is also completely unforecastable. (How's that for a nice little economic paradox?)

This is how it is supposed to work. First, investors become less interested in holding US assets (presumably because they don't like the rest of the following scenario). As a result, the dollar loses value against other currencies. Third, the weaker dollar makes US imports expensive, and US exports more competitive. Fourth, the US trade deficit improves as a result, and the US current account balance with it.

However, we've already seen some of steps numbers 1 and 2, because the dollar has indeed weakened substantially over the past few years. Yet the current account deficit keeps getting bigger, not smaller. What gives?

Menzie Chinn points out an interesting paper by Charles Thomas and Jaime Marquez that tries to help explain why. The point of the paper is that the US dollar has not actually weakened that much, if you look at it the right way. I find the paper's conclusions quite persuasive from a technical standpoint.

But just as importantly, the paper raises a crucial point about exchange rates that many people miss, I fear. The exchange rate and the US current account balance are not related to each other in a simple sequential fashion, in the sense that first the exchange rate changes and then the current account balance responds. Rather, they are both "jointly determined", as economists put it, which simply means that they both affect each other. The causation doesn't just go one way.

In this context, what this means is that the results of the paper by Thomas and Marquez serve as an excellent reminder of the fact that we should not expect the value of the dollar to fall by a lot until the underlying causes of the US current account deficit (namely insufficient national savings, both by individuals and by government) change.

Once US consumption growth slows, and/or consumption growth in the rest of the world picks up, the US current account deficit will be able to fall. This will coincide with a loss in the rest of the world's interest in US assets. And so (with a little lead time to allow for a bit of a J-curve effect) that is when we should expect the value of the dollar to fall, and not before.

Monday, October 16, 2006

Thinking About Oil Prices

A piece in this week's Fortune magazine by Nelson Schwartz has made me think a little about oil prices. The article addresses the question of "Why gas prices dropped". Here's the answer given by Schwartz:
According to Joel Fingerman of Chicago-based OilAnalytics.net, between the peak of $77 a barrel in August and the October low of just under $58, traders dumped nearly 40 million barrels (a 20 percent drop) from their long positions. The volatile gasoline market showed an even sharper decline - with traders cutting long positions from 32 million barrels in midsummer to just 1.7 million in October.

"Whatever you want to call it - speculators, fast money, hot money - a big part of the drop in crude that we've seen this year is because of selling by hedge funds," says Merrill Lynch technical analyst Mary Ann Bartels.
But there are a couple of loose ends that this explanation doesn't tie up. First of all, as I've written about before, it is unclear to me exactly how speculators (as a group) could maintain a long position in a commodity such as oil for an extended period of time (say, for several months or even years) without actually having the physical oil stored somewhere. Doesn't the physical oil actually have to be removed from the spot markets in order for the spot price of oil to be driven up by speculation? Put another way, it's hard for me to see how futures prices can affect spot prices without some physical storage of oil to move the physical oil from today to the future. Given that, and given the fact that government statistics show that the amount of oil being stockpiled around the world has not increased dramatically over the past two years, I'm skeptical about the speculator story.

But here's a second point: suppose that you do believe "speculation" has driven the price of oil up above where it would otherwise be (as Schwartz seems to). For example, the article cites an estimate by prominent energy consultant Joe Stanislaw that the price of oil would be around $50 per barrel if it weren't for speculative activities (in part related to geopolitical instability). Well, then take a look at the picture below.


The picture shows the spot price of oil compared to Stanislaw's $50/bbl guess. The area between $50 and the actual spot price of oil is some sort of "speculation transfer" that oil consumers have paid to oil producers as a result of speculative activity. For the US alone (which consumes about 20 million barrels of oil per day), that "speculation transfer" adds up to over $90 billion in wealth transferred from consumers to oil companies in the past 15 months.

Even to an economist, $90 billion is a lot of money, especially when that figure describes a transfer in wealth from US consumers to oil companies that resulted from simple speculation in the futures markets (again, assuming you believe in the speculation story in the first place). This seems to be something worth a little more thought and attention than simply concluding that speculation happened, and now it's ending, and that's the end of the story.

Friday, October 13, 2006

Tax Cuts Reduced the Budget Deficit!

No, it's not surprising. In fact, it has happened many times already. But I can't help it - I still feel slightly astonished every time that President Bush claims, with a straight face, that the budget deficit is as "low" as it is because of his tax cuts.

He repeated this assertion in his comments about Wednesday's news that the US federal budget deficit for 2006 was only $425 billion or so - or about $250bn once the Social Security trust fund surplus is used to make up part of the deficit.

The tax cuts may indeed have stimulated some economic growth. In 2003 the Republican Congress convened a panel of economists (under the authority of the Joint Committee on Taxation, or JCT) to estimate exactly how much of a positive impact on tax revenues this feedback effect would provide, using a technique called "dynamic scoring" to measure the overall cost of the tax cuts.

This JCT study concluded that there would indeed be positive revenue effects from the economic growth that the tax cuts would stimulate, to the tune of some $30 or $40bn per year. But it turns out that the negative revenue effects of the tax cuts are a bit larger than that. The following picture illustrates.


Maybe it's a little hard to tell from the graph. But looking at the raw data, it seems quite obvious to me that the negative revenue effects of the tax cuts are a fair bit larger than the positive feedback effects from higher economic growth.

What does this mean? Quite simply, it means that if the tax cuts had never happened, then the "low" budget deficit of $425 billion in 2006 ($250bn if you include the SS surplus) would have actually been only about $240 billion ($70 bn if you include the SS surplus). And in general, the somewhat grim fiscal future that the US would have been facing if taxes had not been cut has been turned in to a truly terrifying picture of fiscal irresponsibility.


Yes, that's right, right now we can look forward to General Fund deficits growing from $400 to $500 to $600 to $700 to $800 billion per year. (That assumes that President Bush gets his wish list of tax cut extensions and AMT reform.)

Enjoy today's relatively good budget news. Because it won't last.

Thursday, October 12, 2006

Why "The Street Light"?

There’s an easy explanation for the name of this blog, and a more involved explanation for it. Which do you want?

Both, you say? Very well.

The easy explanation is this: this is a blog largely (though not solely) about things economic and financial. It's about Main Street as well as Wall Street. And ideally, I'd like to shed some light on both of those streets. Or at least give it a good try.

The more involved explanation has to do with an old joke that economists like to tell each other. Okay, maybe “joke” is overselling it a bit – a little story with a modestly amusing punchline might be a better description. But most economists are not generally renowned for their senses of humor, so to us it’s a good joke.

At any rate, my personal version of the joke goes something like this:
Late one evening, a man who was walking his dog comes upon an economist (you can always tell an economist from anyone else at first glance, of course) who is searching the ground under a street light. The passerby asks the economist what he is doing.

“I'm looking for my lost keys,” says the man searching the ground. “I dropped them on my way home from that bar down there” he says with a slight slur, pointing to an establishment of somewhat disreputable appearance at the far end of the street.

The passerby offers to help search for the keys, but after several minutes of searching under the street light they have no luck. “Are you sure you dropped them here?” asks the passerby.

“Oh, I have no idea if I dropped them here," says the economist, now swaying ever so slightly. “All I know is that I think I’m pretty sure that I dropped them somewhere on this street on my way home.”

“Then why are you only looking under this street light?”

“Well…” replies the economist very slowly, blinking with the effort. “Because this is where I can see the best.”
The reason that economists like this story so much is not, despite what you might think, because it involves staying at a bar until late at night. Rather, it's because the story serves as a parable for what economists spend most of their lives doing.

The goal of economic analysis is to gain some understanding about how the economy works, and to try to come up with some explanation for past, current, and future economic phenomena or events. Yet the tools we have to be able to understand something as vast and complex as the world's economy are woefully limited. Returning to the parable: most of the street is pretty dark to us economists. So what we end up doing is trying to understand the economy based on those relatively small areas of the street that our tools of economic analysis do manage to shed some light on. As far as the rest of the street goes, we just sort of have to use a combination of deduction and guesswork.

Personally, I think that the street light that economic analysis provides is truly important (which is comforting, given that I'm an economist) – it helps us to understand things that we wouldn't otherwise be able to figure out. But it also illuminates just a small portion of the world around us. I chose the name for this blog to give me a daily reminder of both of these important points.

Welcome to The Street Light

For about two and a half years, I was one of the principal writers on the blog Angry Bear, writing about economics and politics. It is a great blog, and I had lots of fun with my excellent coauthors trying to keep up with current news in economics and politics in the US. During my time as a principal writer at Angry Bear we saw it all, from the ridiculous to the sublime. True, the ridiculous moments seemed far more common, but oh well.

Then, I was forced to take a bit of hiatus from blogging by the demands of the rest of my life. Yah, it’s that old “real life” excuse: jobs, moving, family, and so forth. It turns out that those things can take up quite a bit of time, if you actually pay attention to them. But now I’m now ready to put all of that behind me and get back to blogging again. This time, however, I’ll be hosting my own show, so to speak. Welcome to my new blog, The Street Light.

Here I plan to share my writing, interpretation, and economic analysis of all sorts of current economic events, with particular emphasis on 1) the financial markets; and 2) economic policy-making. I like those two topics particularly because they are both so byzantine and unfathomable that sticking to those topics will leave less chance for me to be obviously wrong.

I have two primary goals for this blog. My first goal is to help provide some understanding to non-economists of what the heck economists are talking about. I think that many economists actually do important economic analysis that can actually provide some pretty good insights into a lot of today’s important topics – but since economists are typically so bad at communicating, those insights are often lost on most people. I’d like to help bridge that gap in communication, at least a little. (Ideally I should have a certificate in English-Econobabble translation, but I suppose I’m just going to have to wing it.)

My second goal is to actually provide some actual economic analysis of current economic events. The analysis that I present here is not intended to provided the definitive end-of-debate answer, of course; instead, the goal is to offer quick and timely first looks at a particular issue, event, or phenomenon that help to clarify what’s going on. Expect a hearty diet of lots of charts and graphs.

How well I manage to achieve these two goals will have to be judged by my readers, of course. But if I manage to help anyone – even myself – to understand what’s going on the world in a somewhat new or different way, then I’ll feel satisfied.